How Many Auth Options Does the Typical Signup Screen Show?
Across 494 chooser screens (out of 998 vision-covered auth screens) tracked by Lazyweb Research, the mean is 2.0 auth options and the single most common layout is just one option, on 40.7% of chooser screens.[1][2] Roughly 70% show one or two options; only 14% show four or more.
Signup chooser screens average 2.0 auth options, with 40.7% showing just one — across 494 chooser screens (Lazyweb Research, July 2026).
| Item | Share of 494 |
|---|---|
| 1 | 40.7% [2] |
| 2 | 29.8% [3] |
| 3 | 15.6% [5] |
| 4 | 12.6% [6] |
| 5 | 1.4% [7] |
The finding
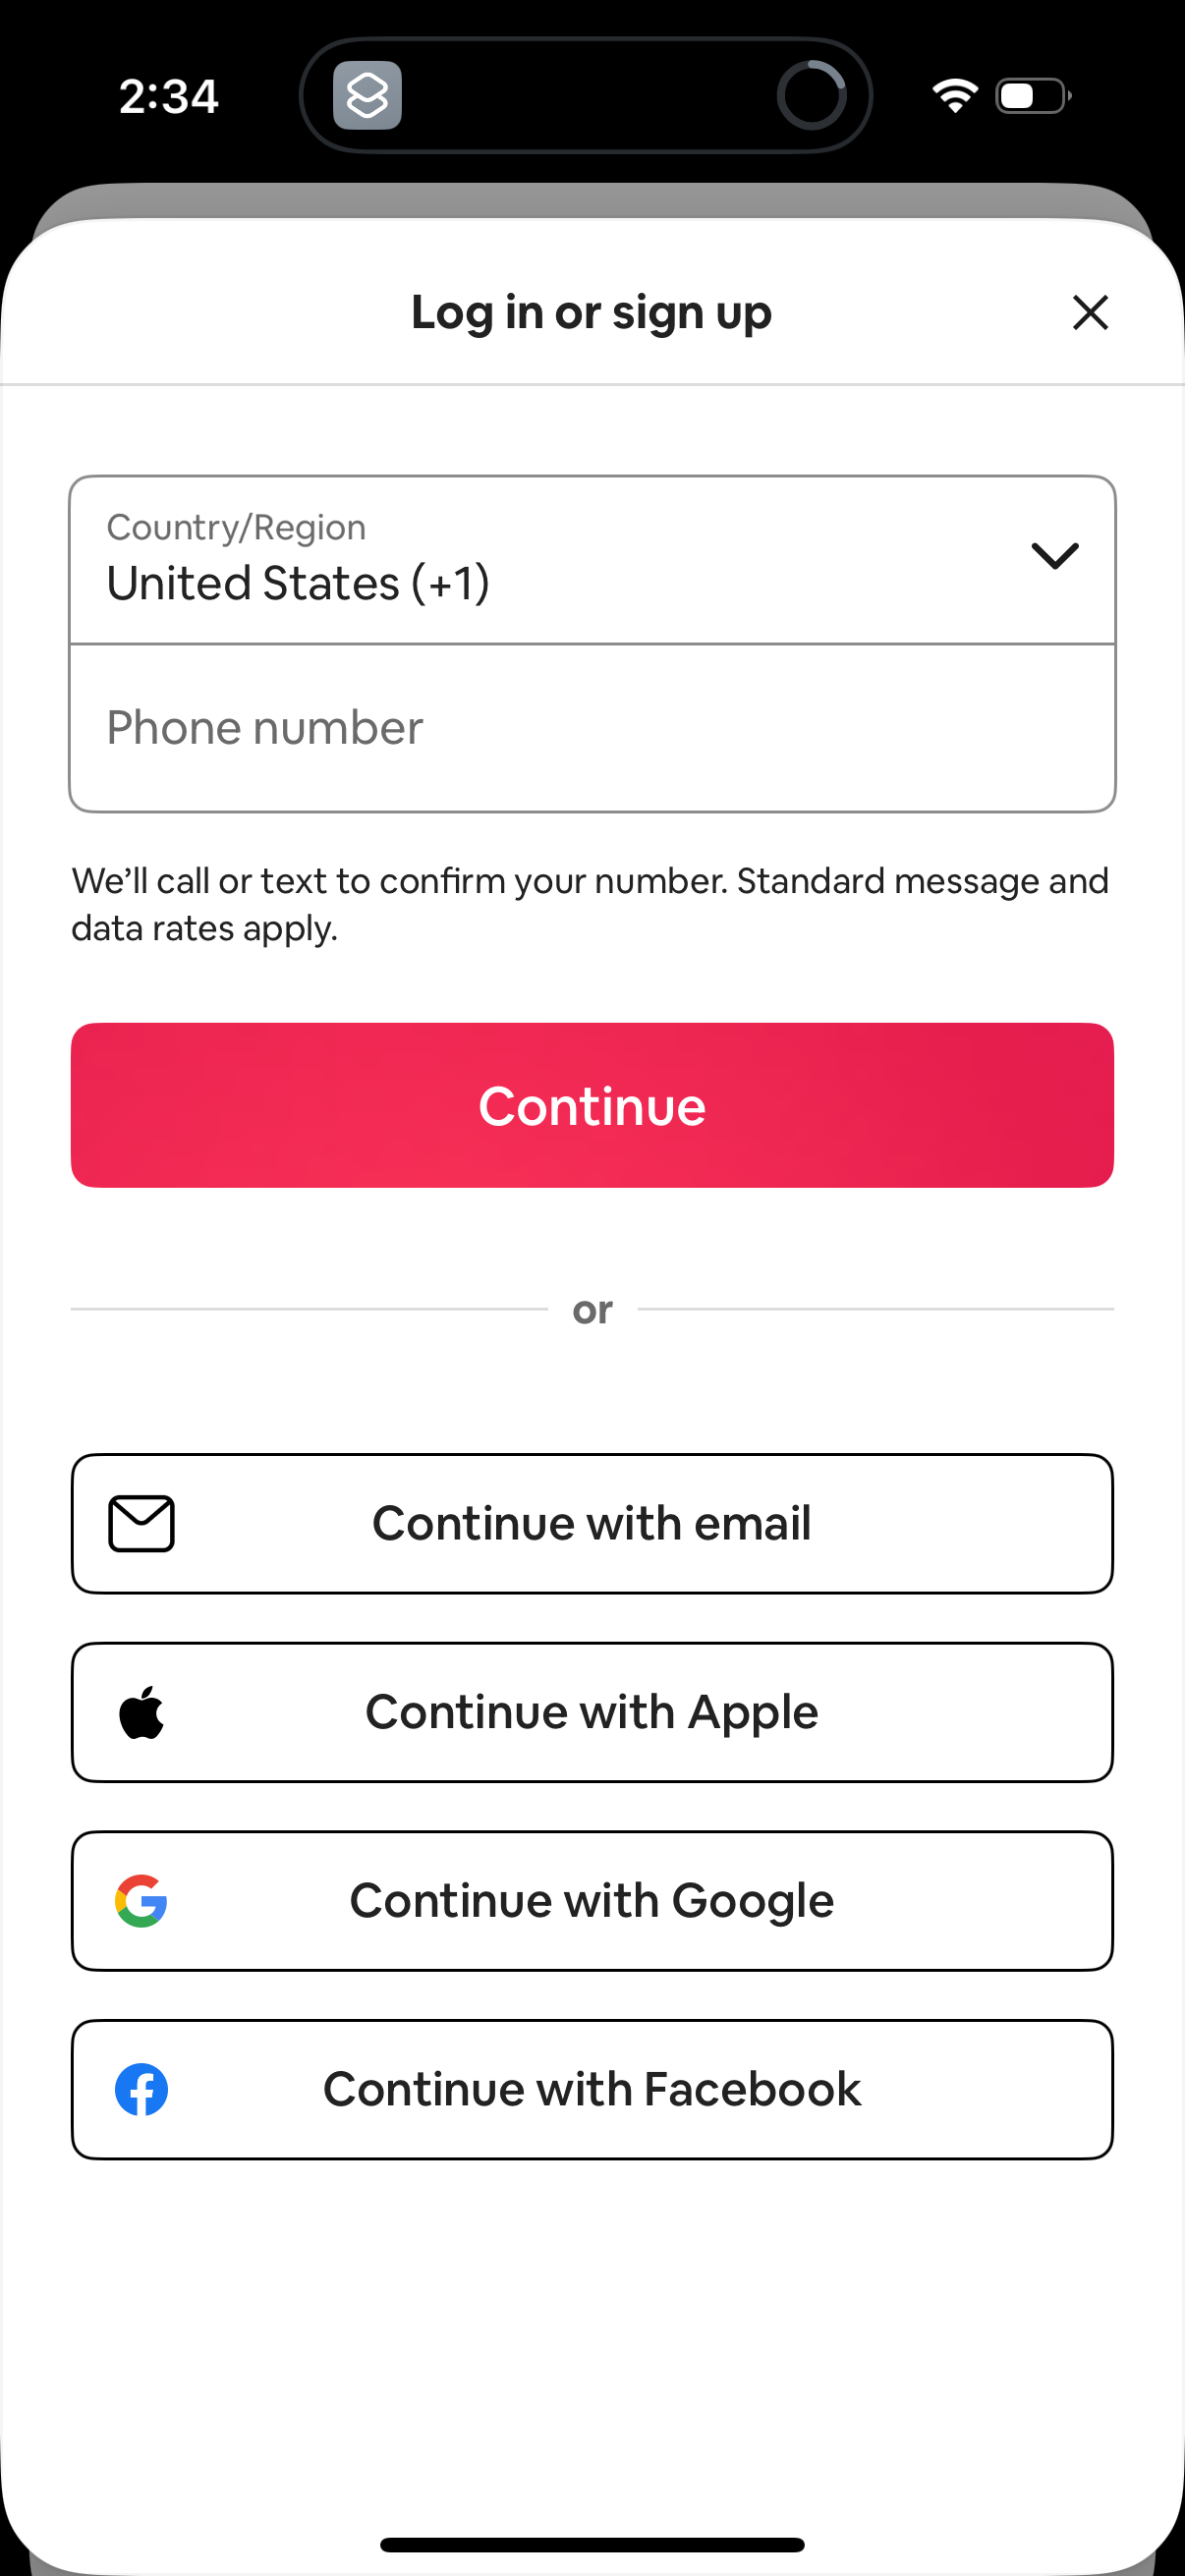
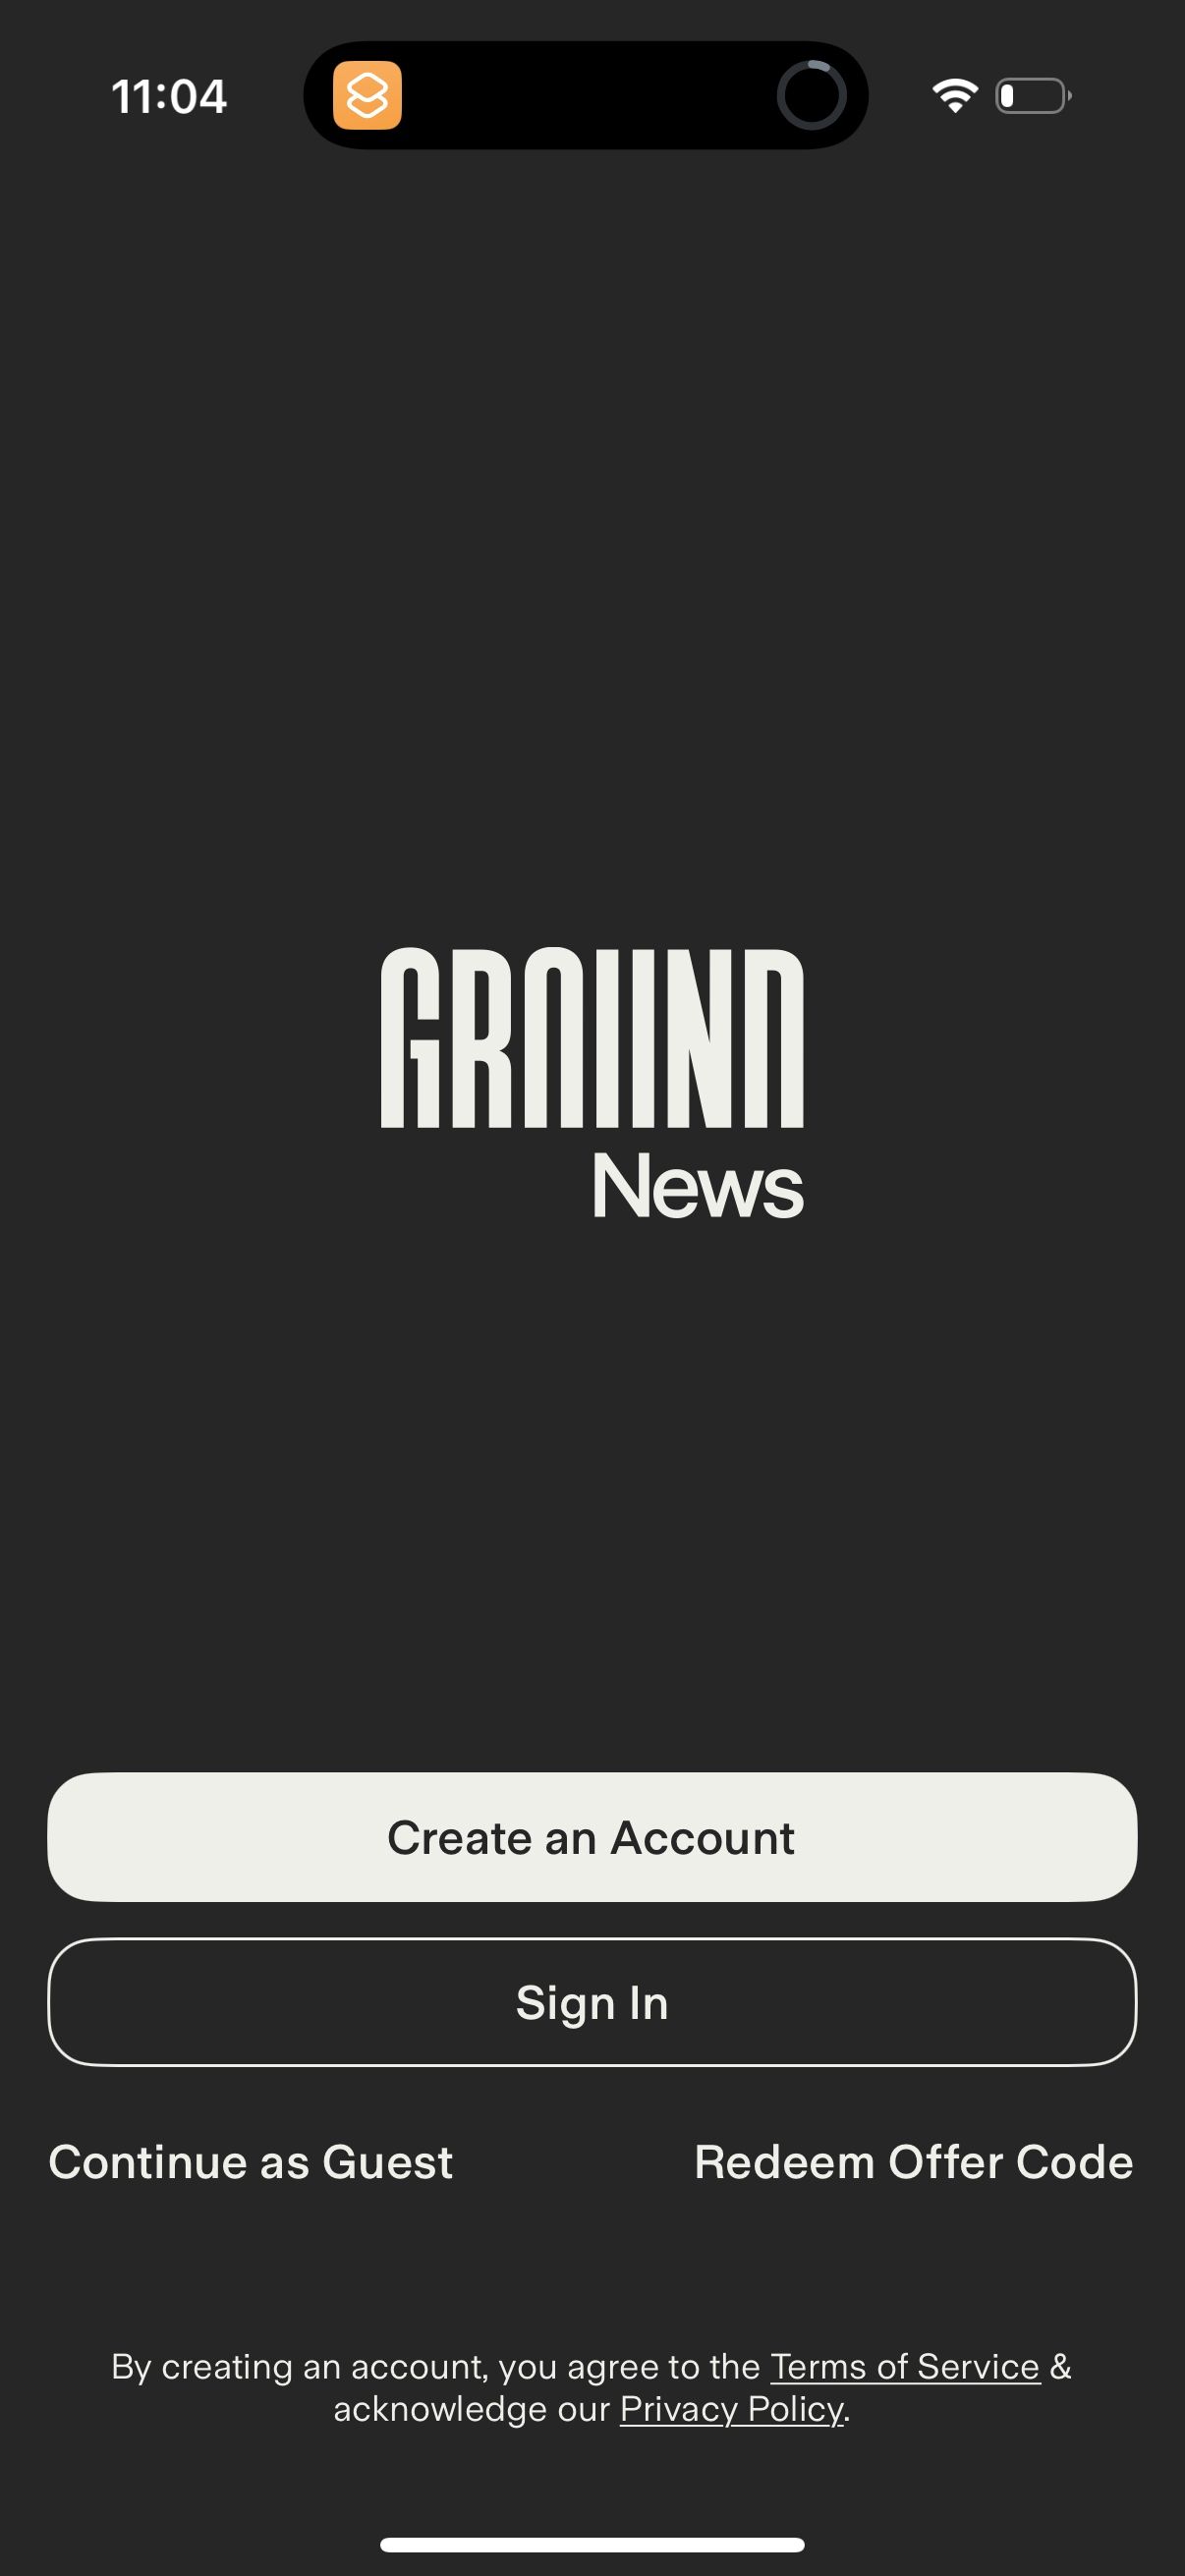
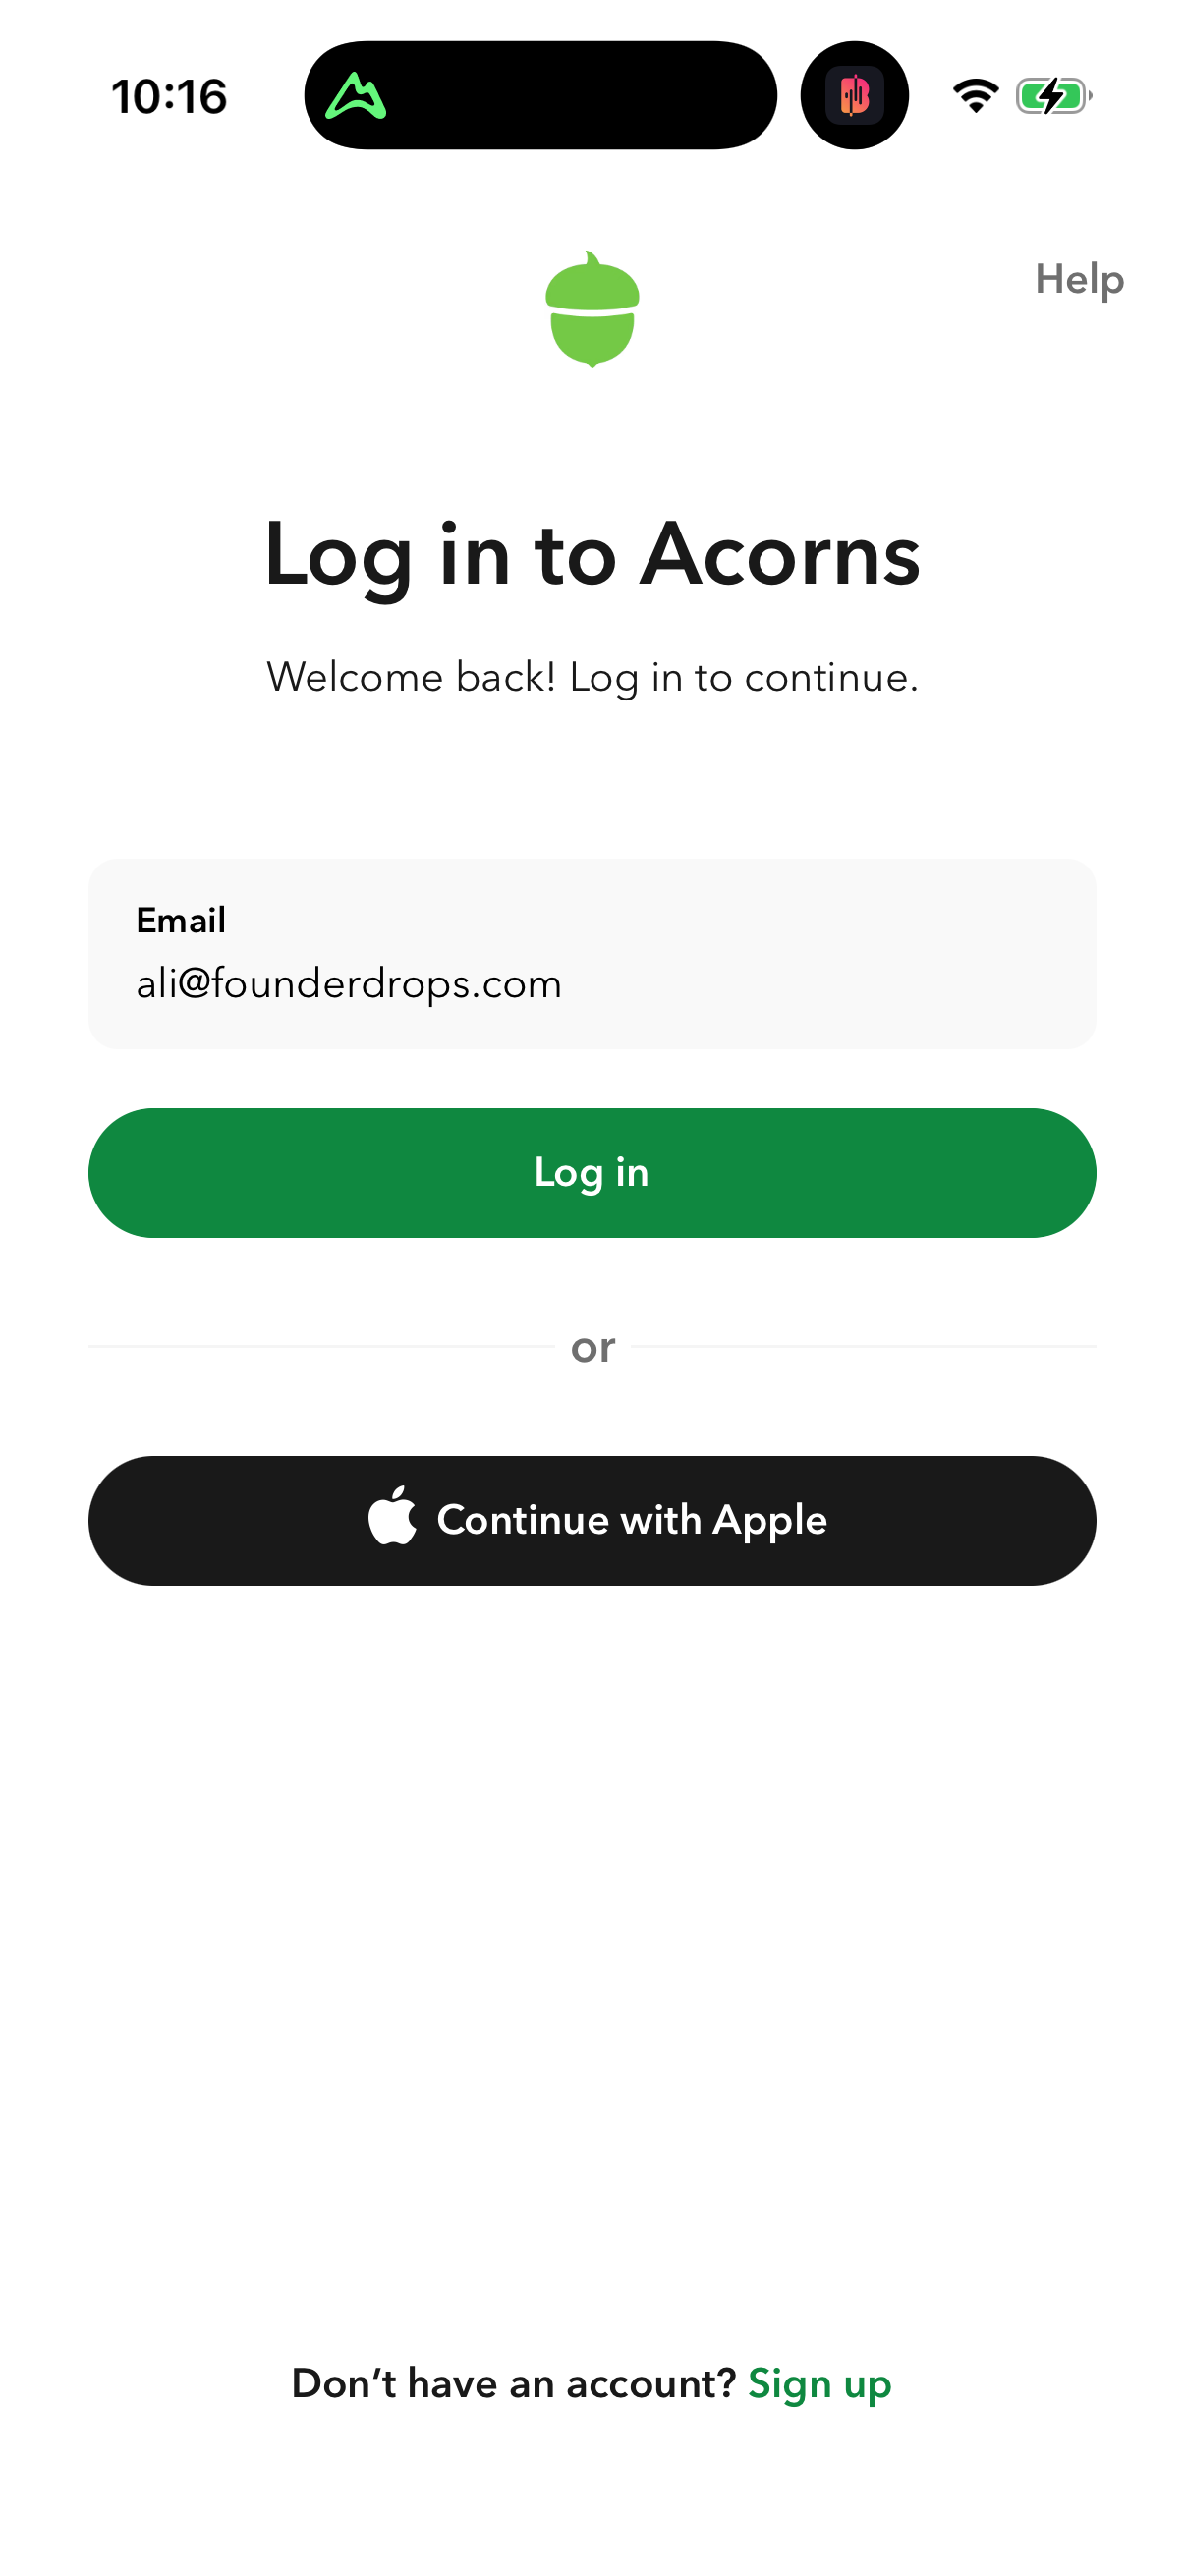
Among the 494 auth screens where at least one provider chooser was detectable, the mean number of options is 2.0.[1] A single option is the most common layout at 40.7% (201 screens); two options account for 29.8% (147).[2][3] So about 70% of chooser screens present one or two paths. Four or more options is uncommon — 14.0% combined.[4]
Options-per-screen distribution
The distribution is front-loaded: the majority of chooser screens keep it to one or two choices, and packed 4-5 option walls are rare (14.0% combined).[4]
How to apply it
A single prominent option (often Continue with Google/Apple or an email field) is the modal design, not a five-button wall.[2] If you are debating how many auth buttons to stack, the tracked norm is restraint: two options is already above the single-option modal layout, and stacking four or more puts you in the 14.0% minority of chooser screens.[4] Lead with one primary path and tuck the rest behind 'other options' if needed.
Caveats
This distribution describes chooser screens only: 504 of the 998 vision-covered auth screens were excluded because they are password-entry, OTP, or mid-flow states with no visible provider chooser.[1][8] Option counting is extraction-based (Apple/Google/Facebook/email/phone/Microsoft/X detection), so it may undercount options rendered as non-standard buttons.
The numbers
| Stat | Computed from |
|---|---|
| mean 2.0 options; 494 of 998 vision-covered auth screens are chooser screens | auth_options_per_screen_distribution: mean 2.0, n=494 chooser of 998 covered |
| 40.7% (201/494) | auth_options_per_screen_distribution: 1 option |
| 29.8% (147/494) | auth_options_per_screen_distribution: 2 options |
| 14.0% (69/494) | auth_options_per_screen_distribution: 4 options (62) + 5 options (7) = 69/494 = 14.0% |
| 15.6% (77/494) | auth_options_per_screen_distribution: 3 options |
| 12.6% (62/494) | auth_options_per_screen_distribution: 4 options |
| 1.4% (7/494) | auth_options_per_screen_distribution: 5 options |
| 504 excluded screens | auth_options_per_screen_distribution: 504 of 998 covered screens are non-chooser (password/OTP/mid-flow) |
Sources & citations
- [1] Lazyweb Research analysis of 494 chooser screens (vision-covered auth screens with a detectable provider chooser), July 2026. Per-screen option count = sum of detected providers (Apple/Google/Facebook/email/phone/Microsoft/X) via bool_or over screenshots per canonical screen; excludes 504 non-chooser states. ↩
Source: Lazyweb Research — proprietary analysis of real, in-market app screens. Cite as Lazyweb Research, 2026-07-07.