What Percentage of Apps Offer Sign In With Apple vs Google vs Email?
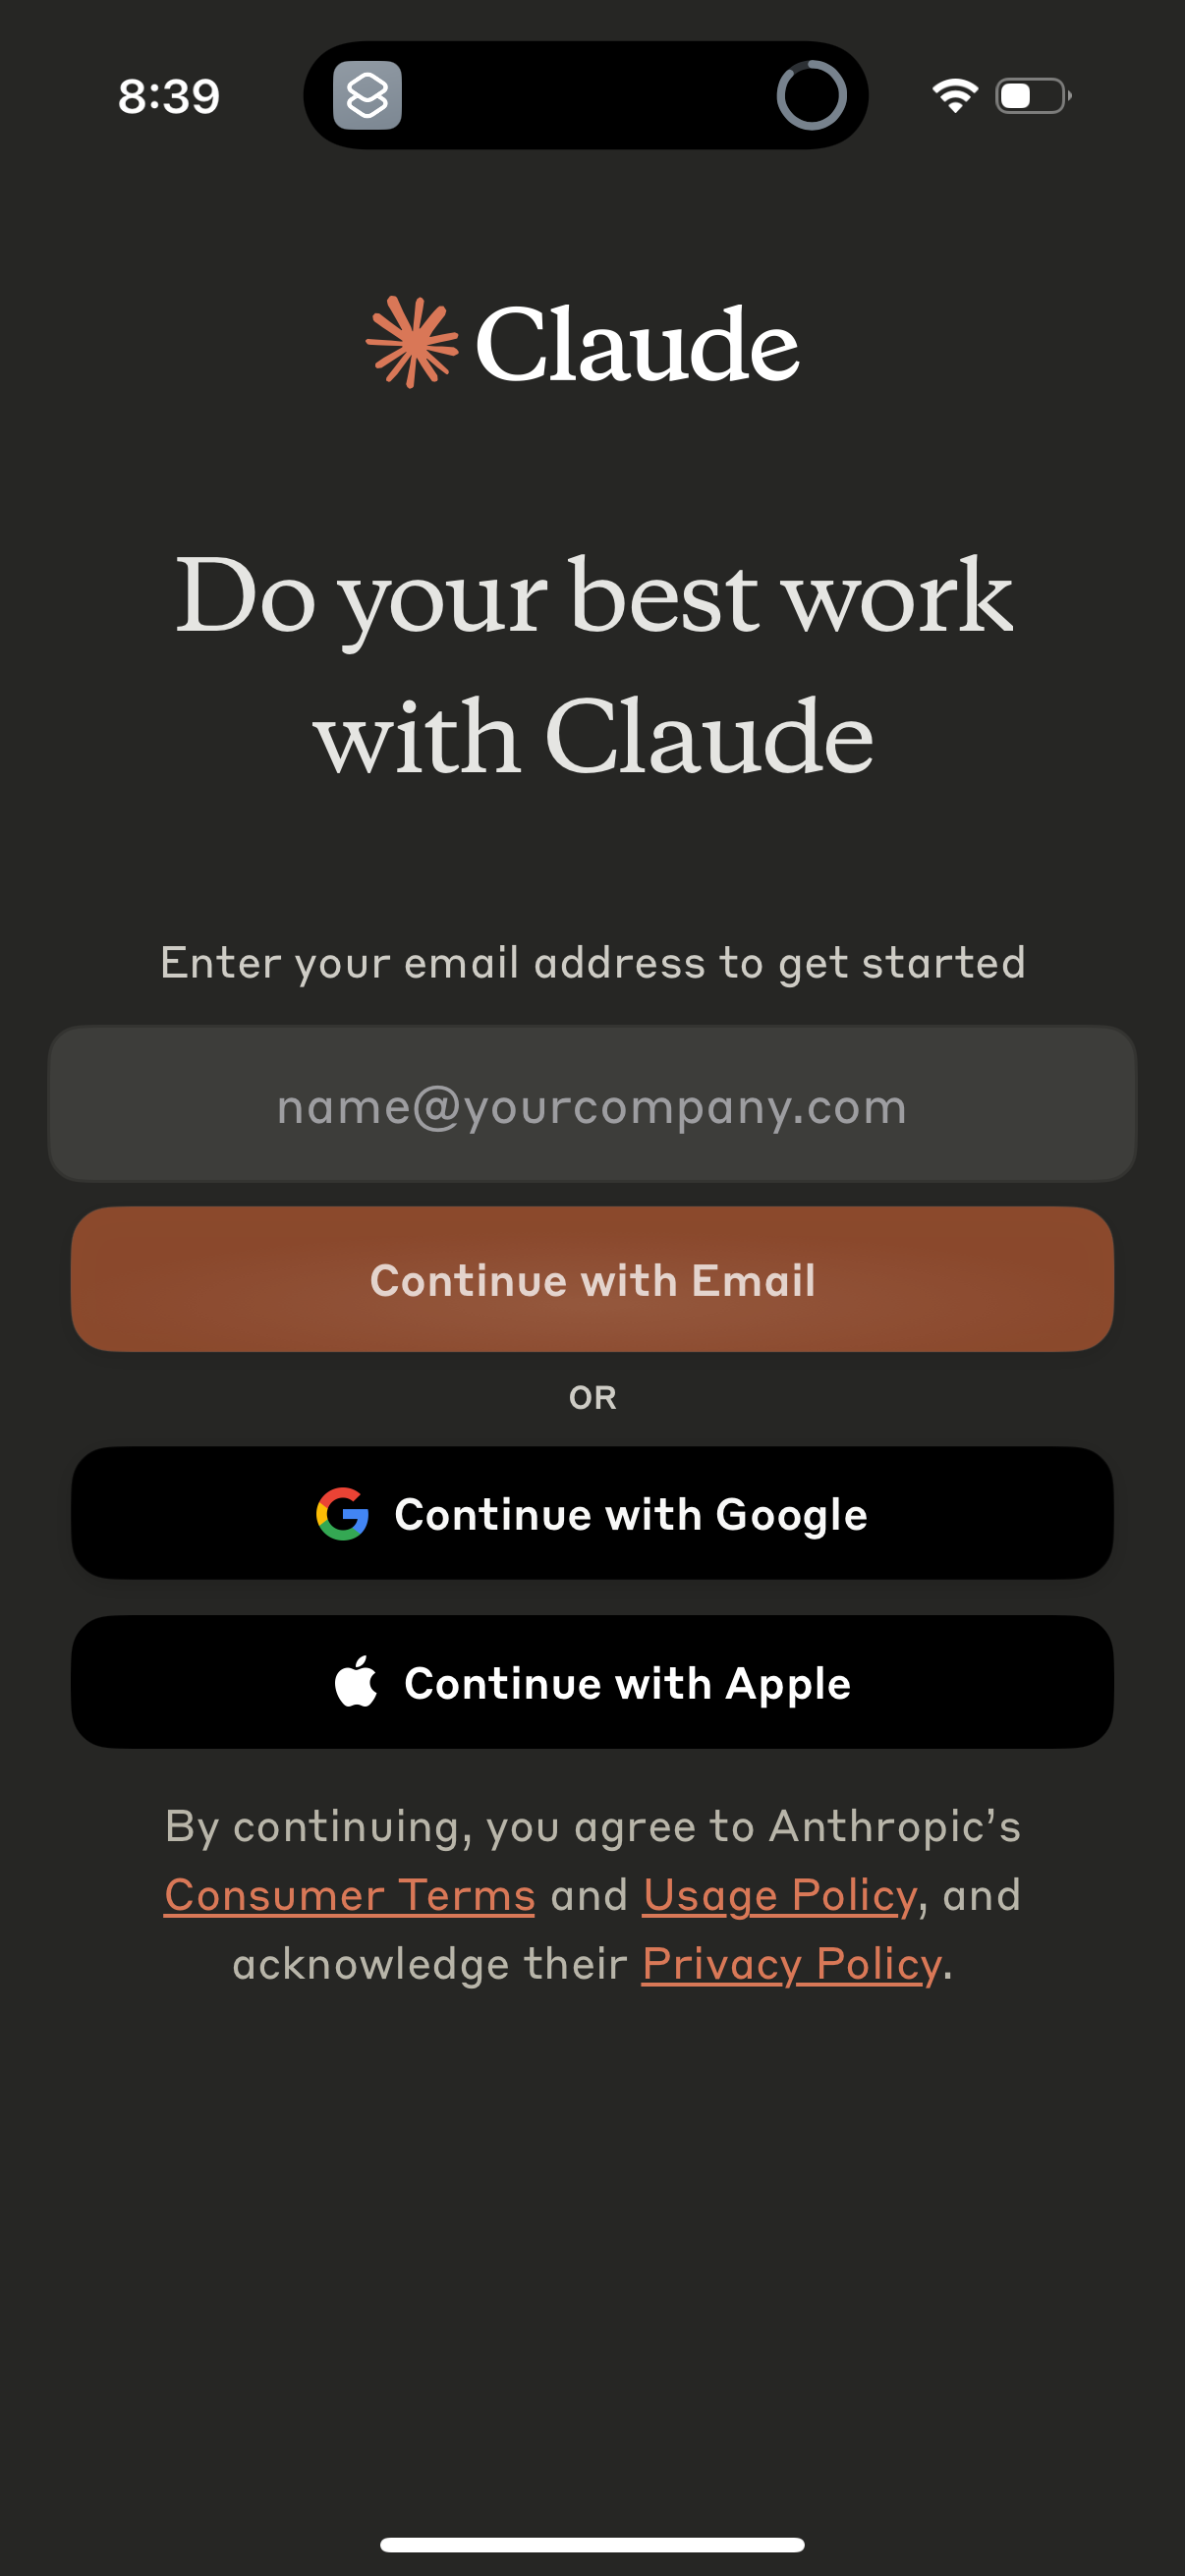
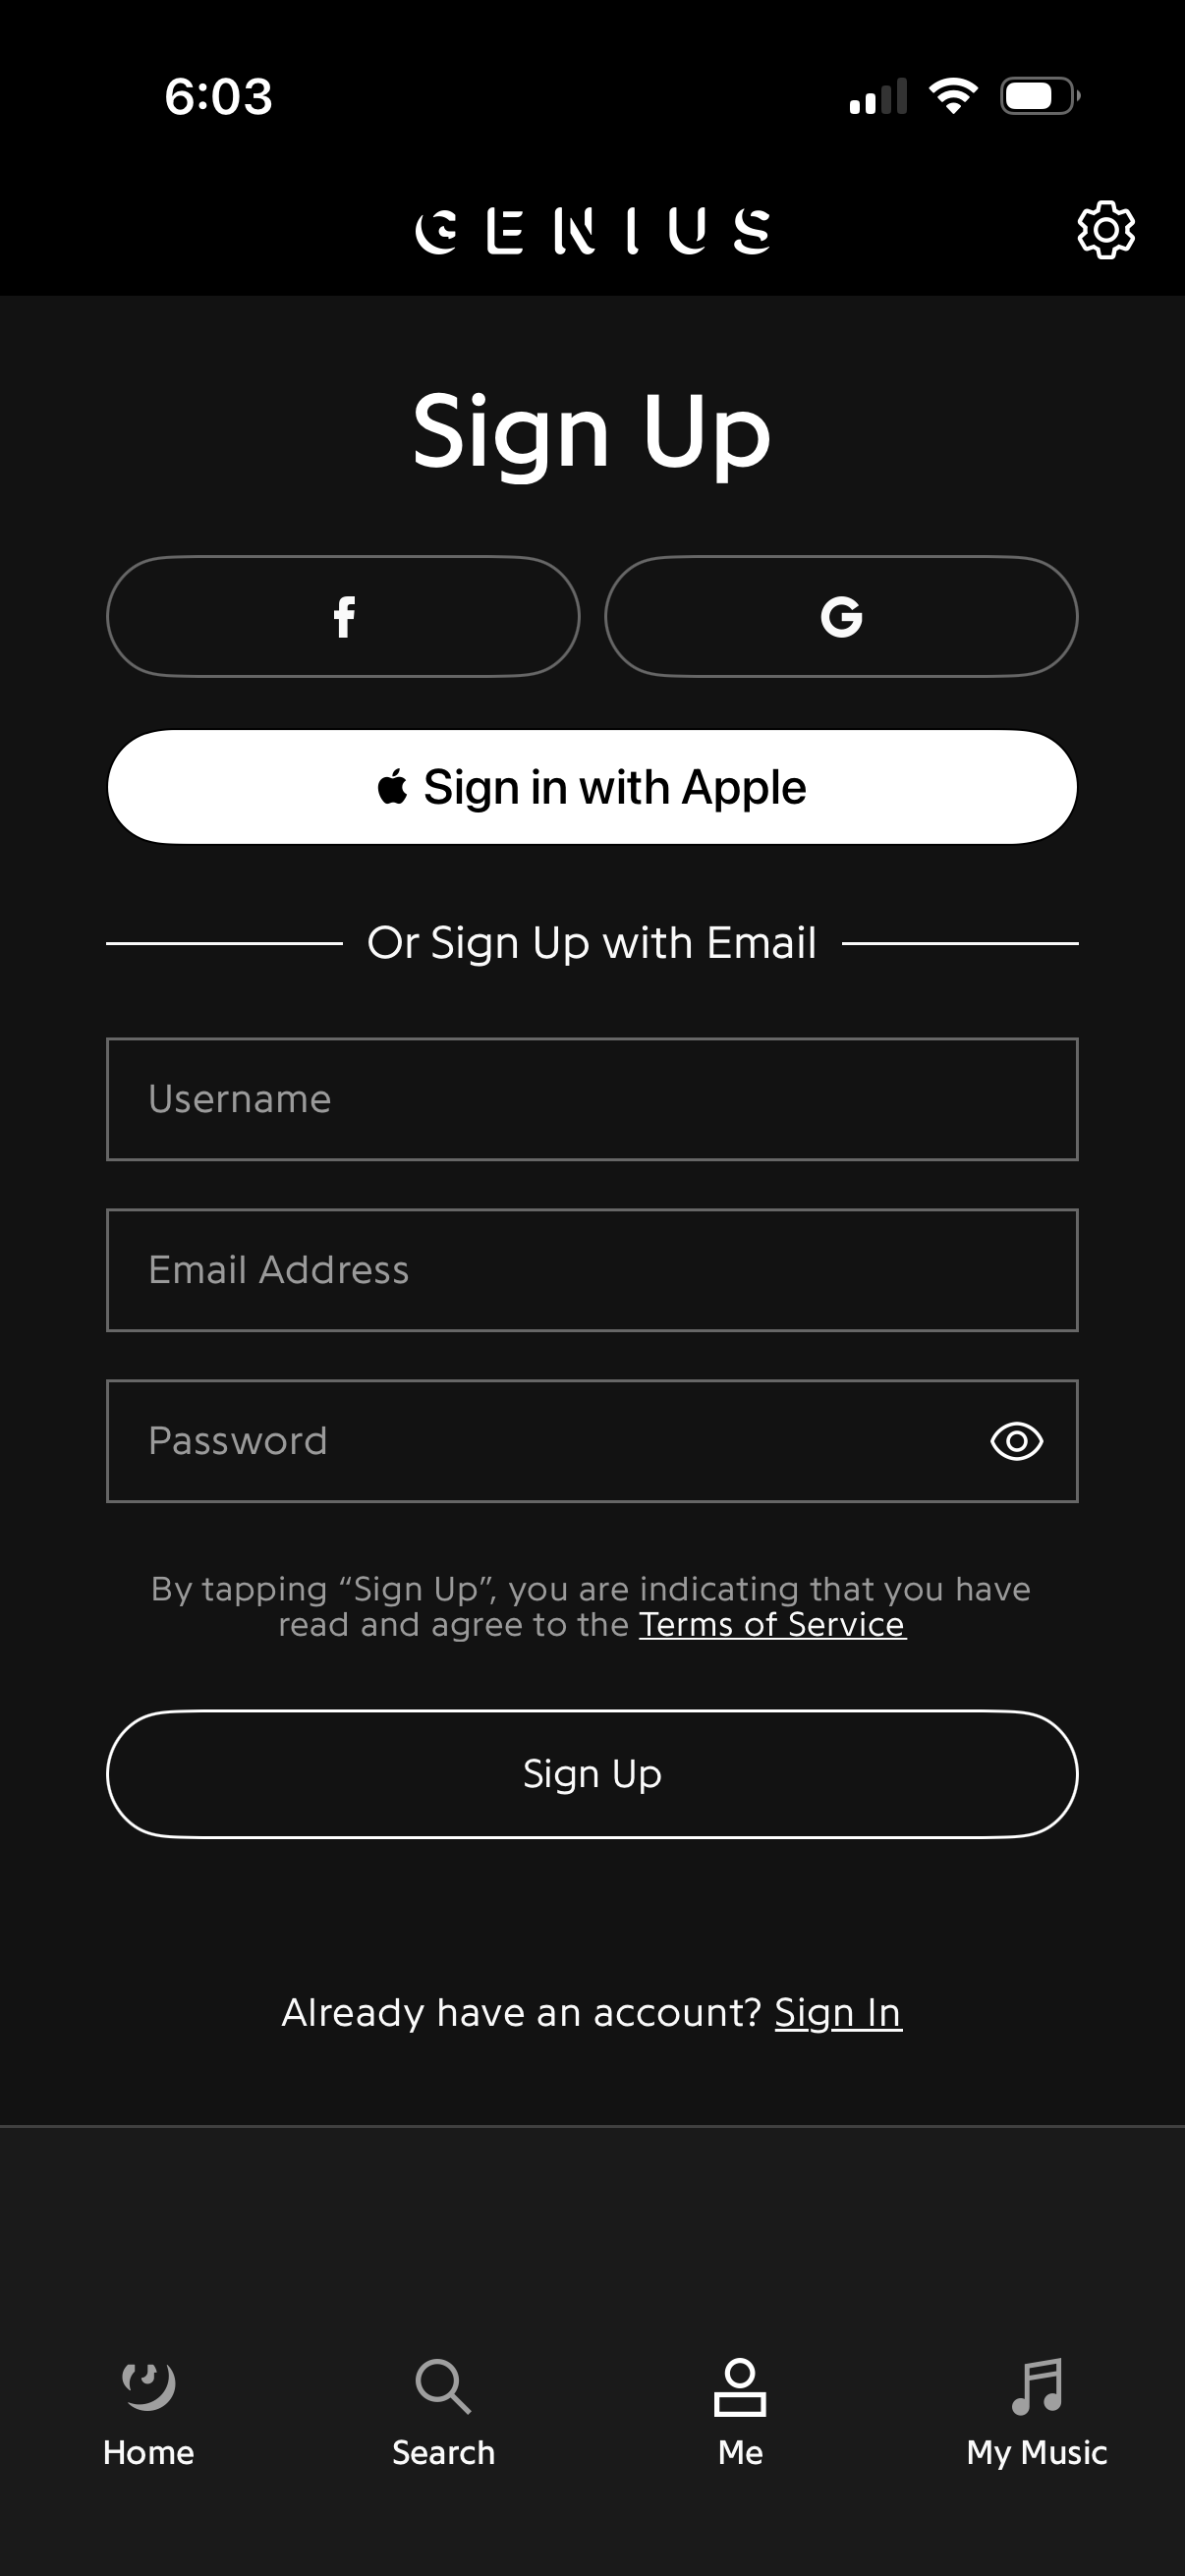
Across 289 apps with vision-extracted signup/login screens tracked by Lazyweb Research, 72.7% show an email option, 48.8% show Sign in with Google, and 43.6% show Sign in with Apple.[1] Email is still the most common path by a wide margin; the two big social providers land within five points of each other. Facebook trails far behind at 22.1%.
Of 289 apps with captured auth screens, 72.7% surface email, 48.8% Google, and 43.6% Apple sign-in (Lazyweb Research, July 2026).
| Item | Share of 289 |
|---|---|
| 72.7% [1] | |
| 48.8% [2] | |
| Apple | 43.6% [3] |
| Phone / OTP | 26.0% [5] |
| 22.1% [4] |
The finding
Among the 289 apps whose signup/login screens were vision-extracted, email-based auth appears on 72.7% (210 apps), Sign in with Google on 48.8% (141), and Sign in with Apple on 43.6% (126).[1][2][3] Facebook login shows up on just 22.1% (64 apps) and phone/OTP on 26.0% (75).[4][5] Email remains the default backbone; Apple and Google are effectively co-standard, differing by only 5.2 points.
Provider prevalence
| Provider | Apps showing it | Share of 289 |
|---|---|---|
| 210 | 72.7% [1] | |
| 141 | 48.8% [2] | |
| Apple | 126 | 43.6% [3] |
| Phone / OTP | 75 | 26.0% [5] |
| 64 | 22.1% [4] |
Counts are per-company (COUNT DISTINCT company), so an app is counted once regardless of how many auth screens it has.
How to apply it
If you are choosing which providers to ship, email plus Google plus Apple covers the modern default — that trio is what roughly half or more of tracked apps present. Facebook is now a minority choice (22.1%),[4] so treat it as optional rather than table-stakes. On iOS, Apple's App Store guidelines effectively force Apple sign-in wherever another third-party social login exists, which is why Apple (43.6%) tracks so closely with Google (48.8%).[2][3]
Caveats
Prevalence is extraction-based: it reflects what vision text found on the 289 apps' captured auth screens, not a ground-truth audit of every provider each app supports.[1] Absence of a match is not proof the app lacks the provider. The email figure (72.7%) uses a loose 'email' match and is an upper bound.[6]
The numbers
| Stat | Computed from |
|---|---|
| 72.7% (210/289) | email_auth_prevalence: 210 of 289 vision-covered apps show email auth |
| 48.8% (141/289) | sign_in_with_google_prevalence: 141 of 289 show Sign in with Google |
| 43.6% (126/289) | sign_in_with_apple_prevalence: 126 of 289 show Sign in with Apple |
| 22.1% (64/289) | facebook_auth_prevalence: 64 of 289 show Facebook login |
| 26.0% (75/289) | phone_auth_prevalence: 75 of 289 involve phone/OTP |
| 5.2 points | 48.8% Google minus 43.6% Apple |
Sources & citations
- [1] Lazyweb Research analysis of 289 apps (mobile apps with vision-extracted auth screens), July 2026. Per-company provider prevalence via vision-text regex over 289 apps that have >=1 vision-covered signup/login canonical screen; denominator is COUNT(DISTINCT company). ↩
Source: Lazyweb Research — proprietary analysis of real, in-market app screens. Cite as Lazyweb Research, 2026-07-07.