What percent of apps use a setup checklist after signup?
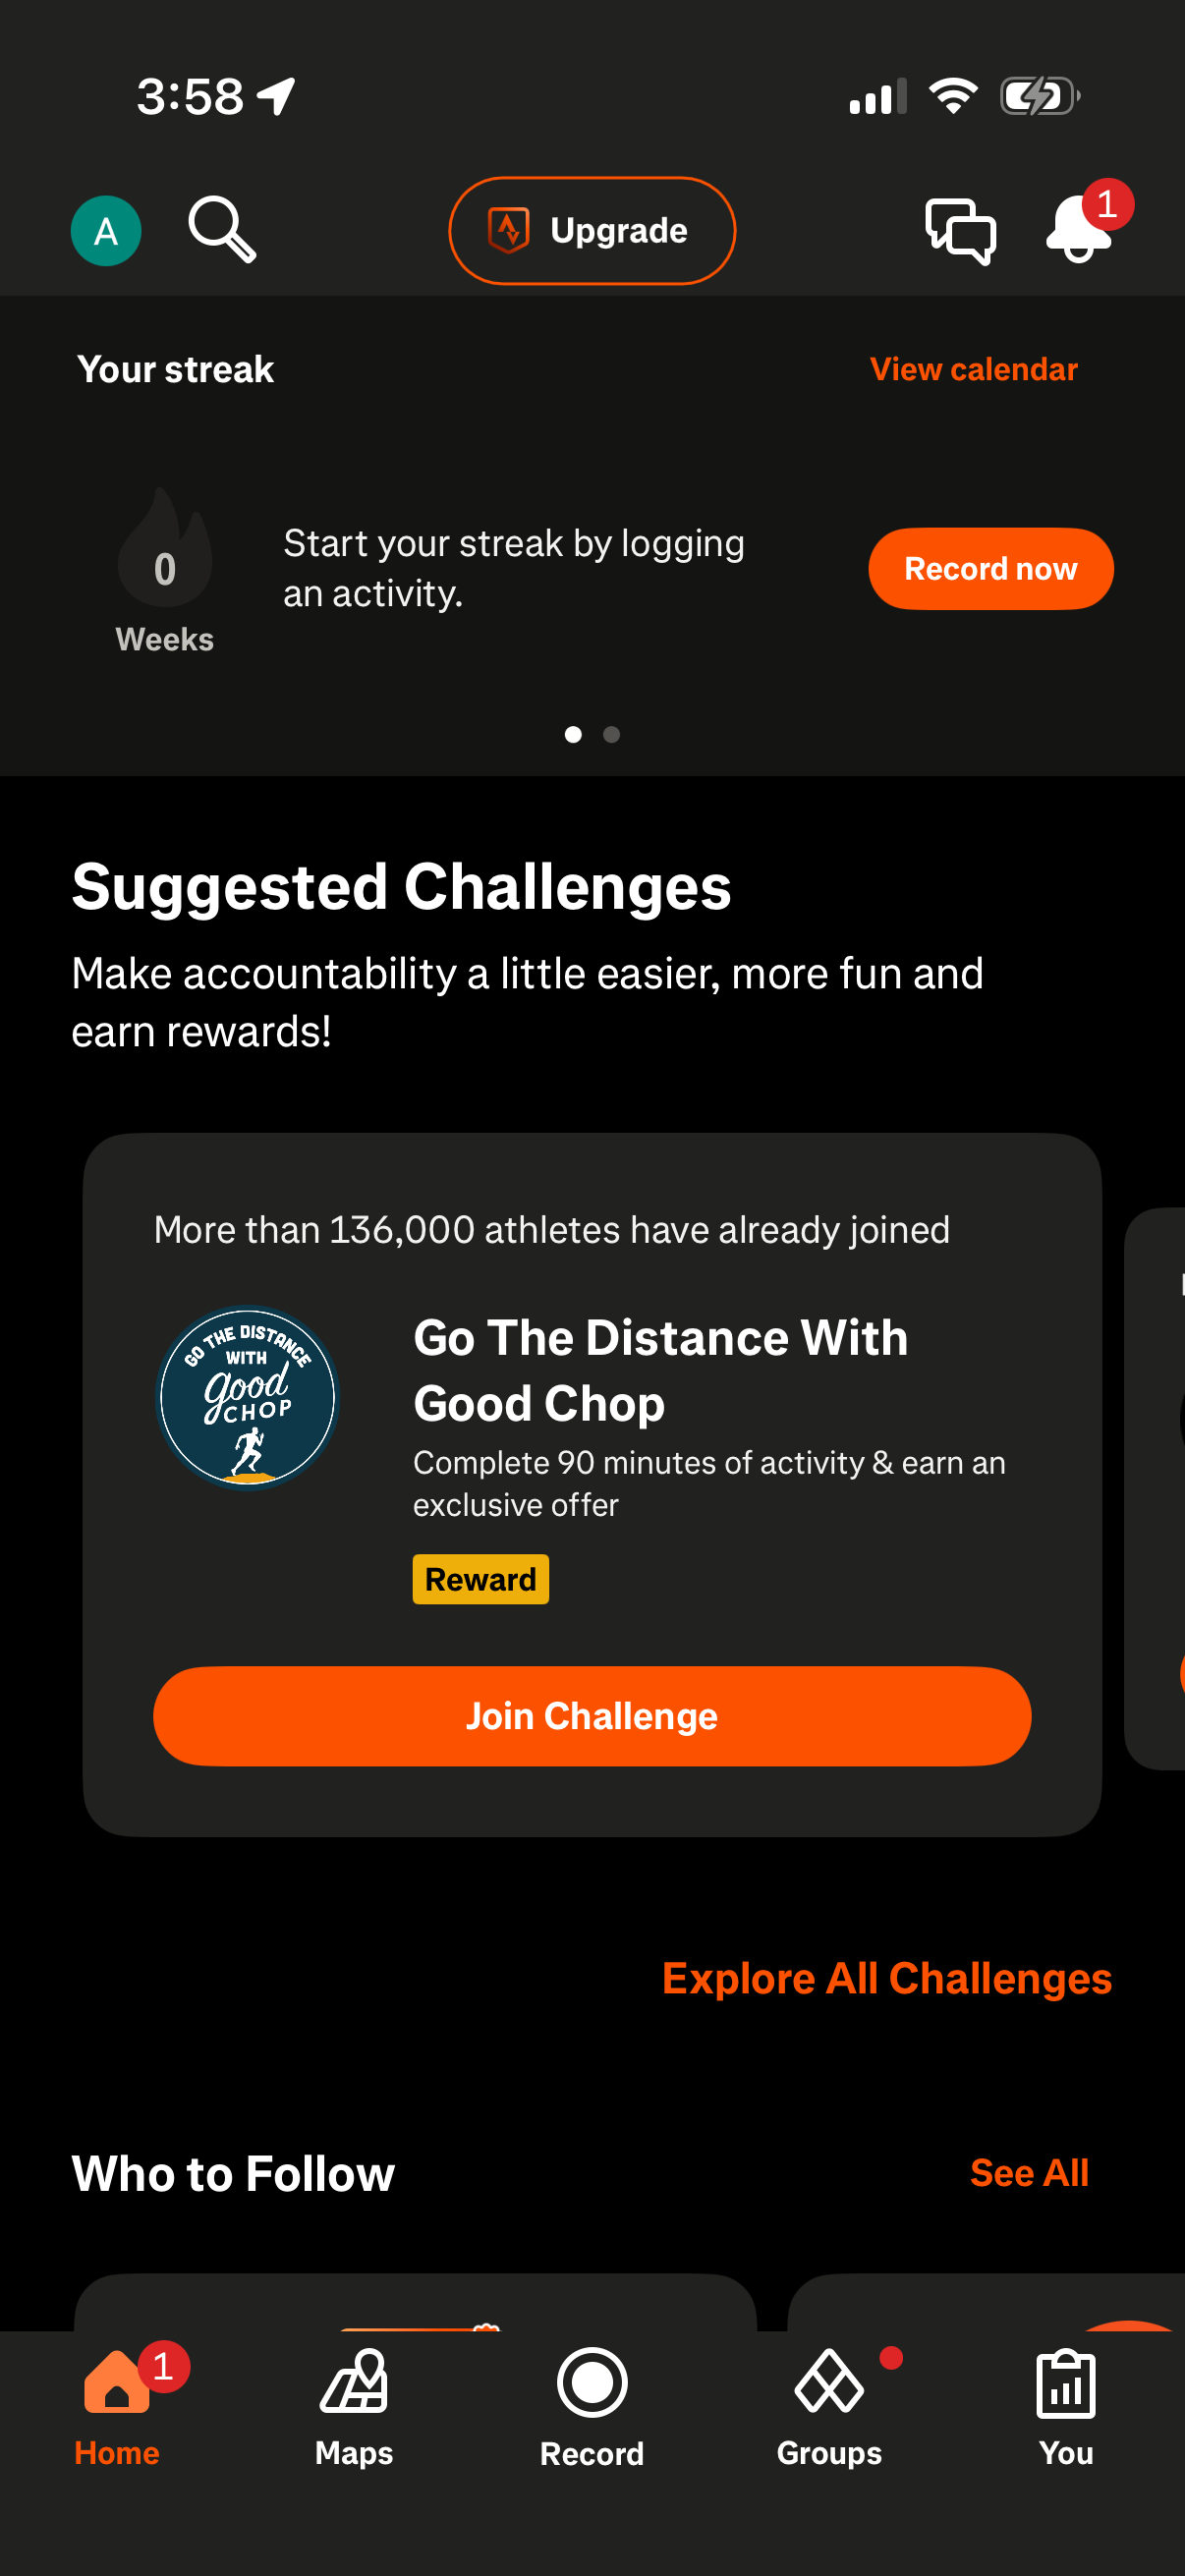
About 13% of tracked apps — 107 of 809 — ship a checklist-tagged activation screen [1]. That is a strict lower bound from tag matching; a broad "get started" matcher inflates to 413 apps (51%), but most of those are welcome-screen CTAs, not real multi-step checklists [2]. For a defensible number, use 107 apps / 13%.
107 of 809 tracked apps (13%) ship a setup-checklist activation screen — Lazyweb Research, July 2026.
| Item | Apps with a checklist |
|---|---|
| Health & Fitness | 19 |
| News | 10 |
| Productivity | 8 |
The defensible number vs the inflated one
Two matchers give very different answers, and the gap is the whole story [1][2]:
| Matcher | Apps | Share of 809 | Use it? |
|---|---|---|---|
Strict (%checklist%) | 107 | 13% | Yes — headline |
| Broad (checklist OR "get started" / "getting started") | 413 | 51% | No — inflated |
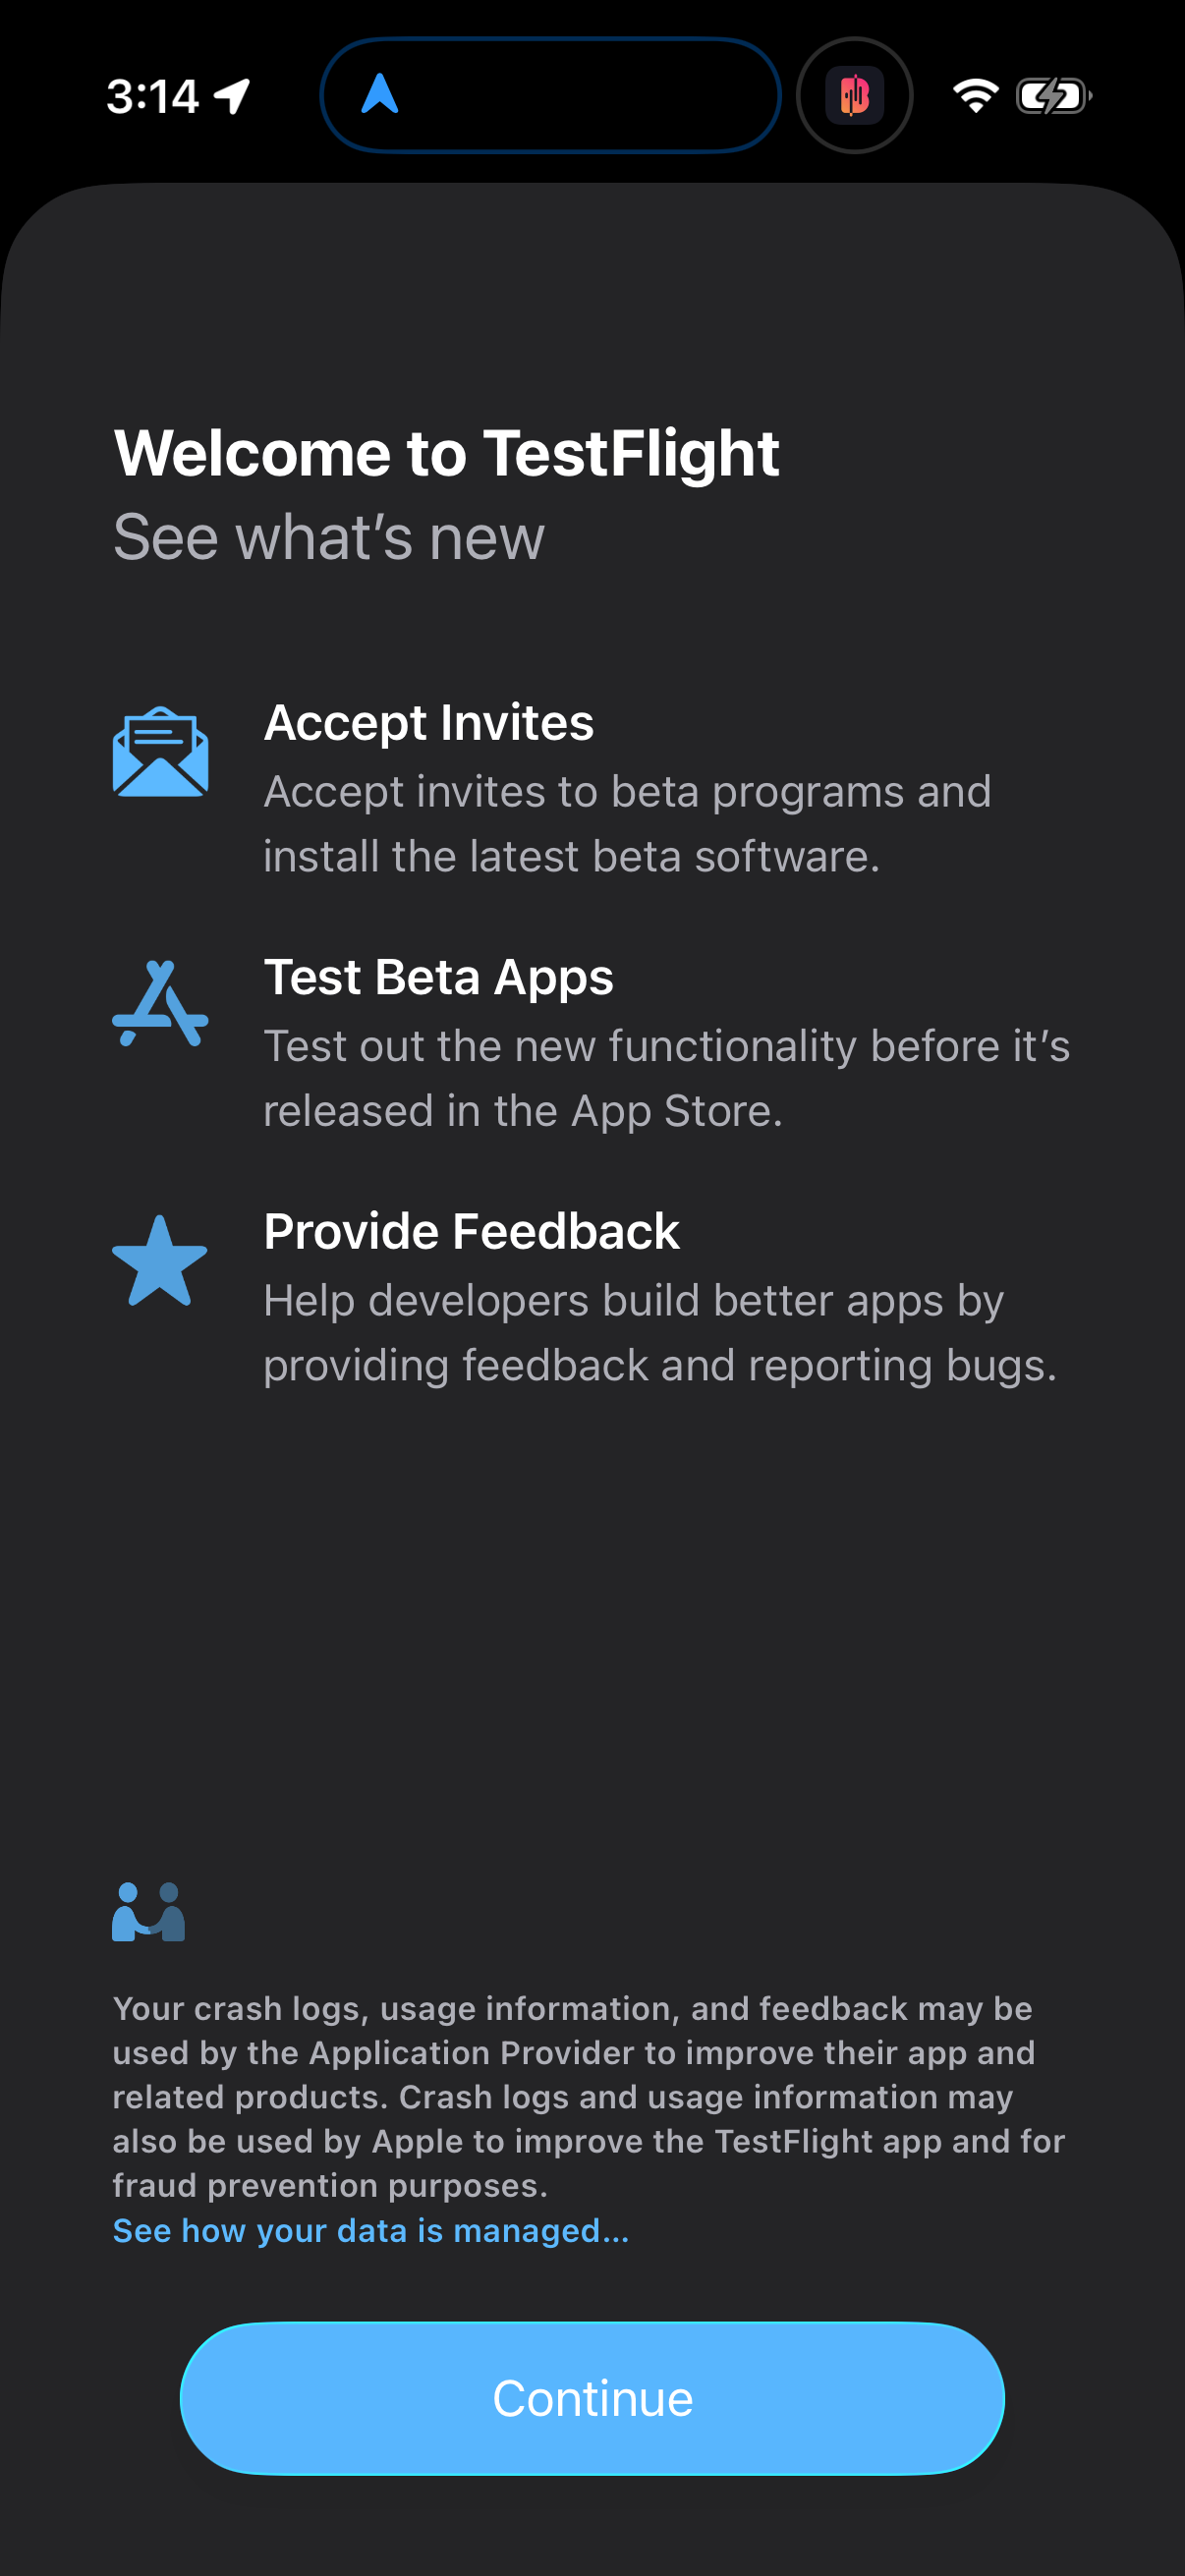
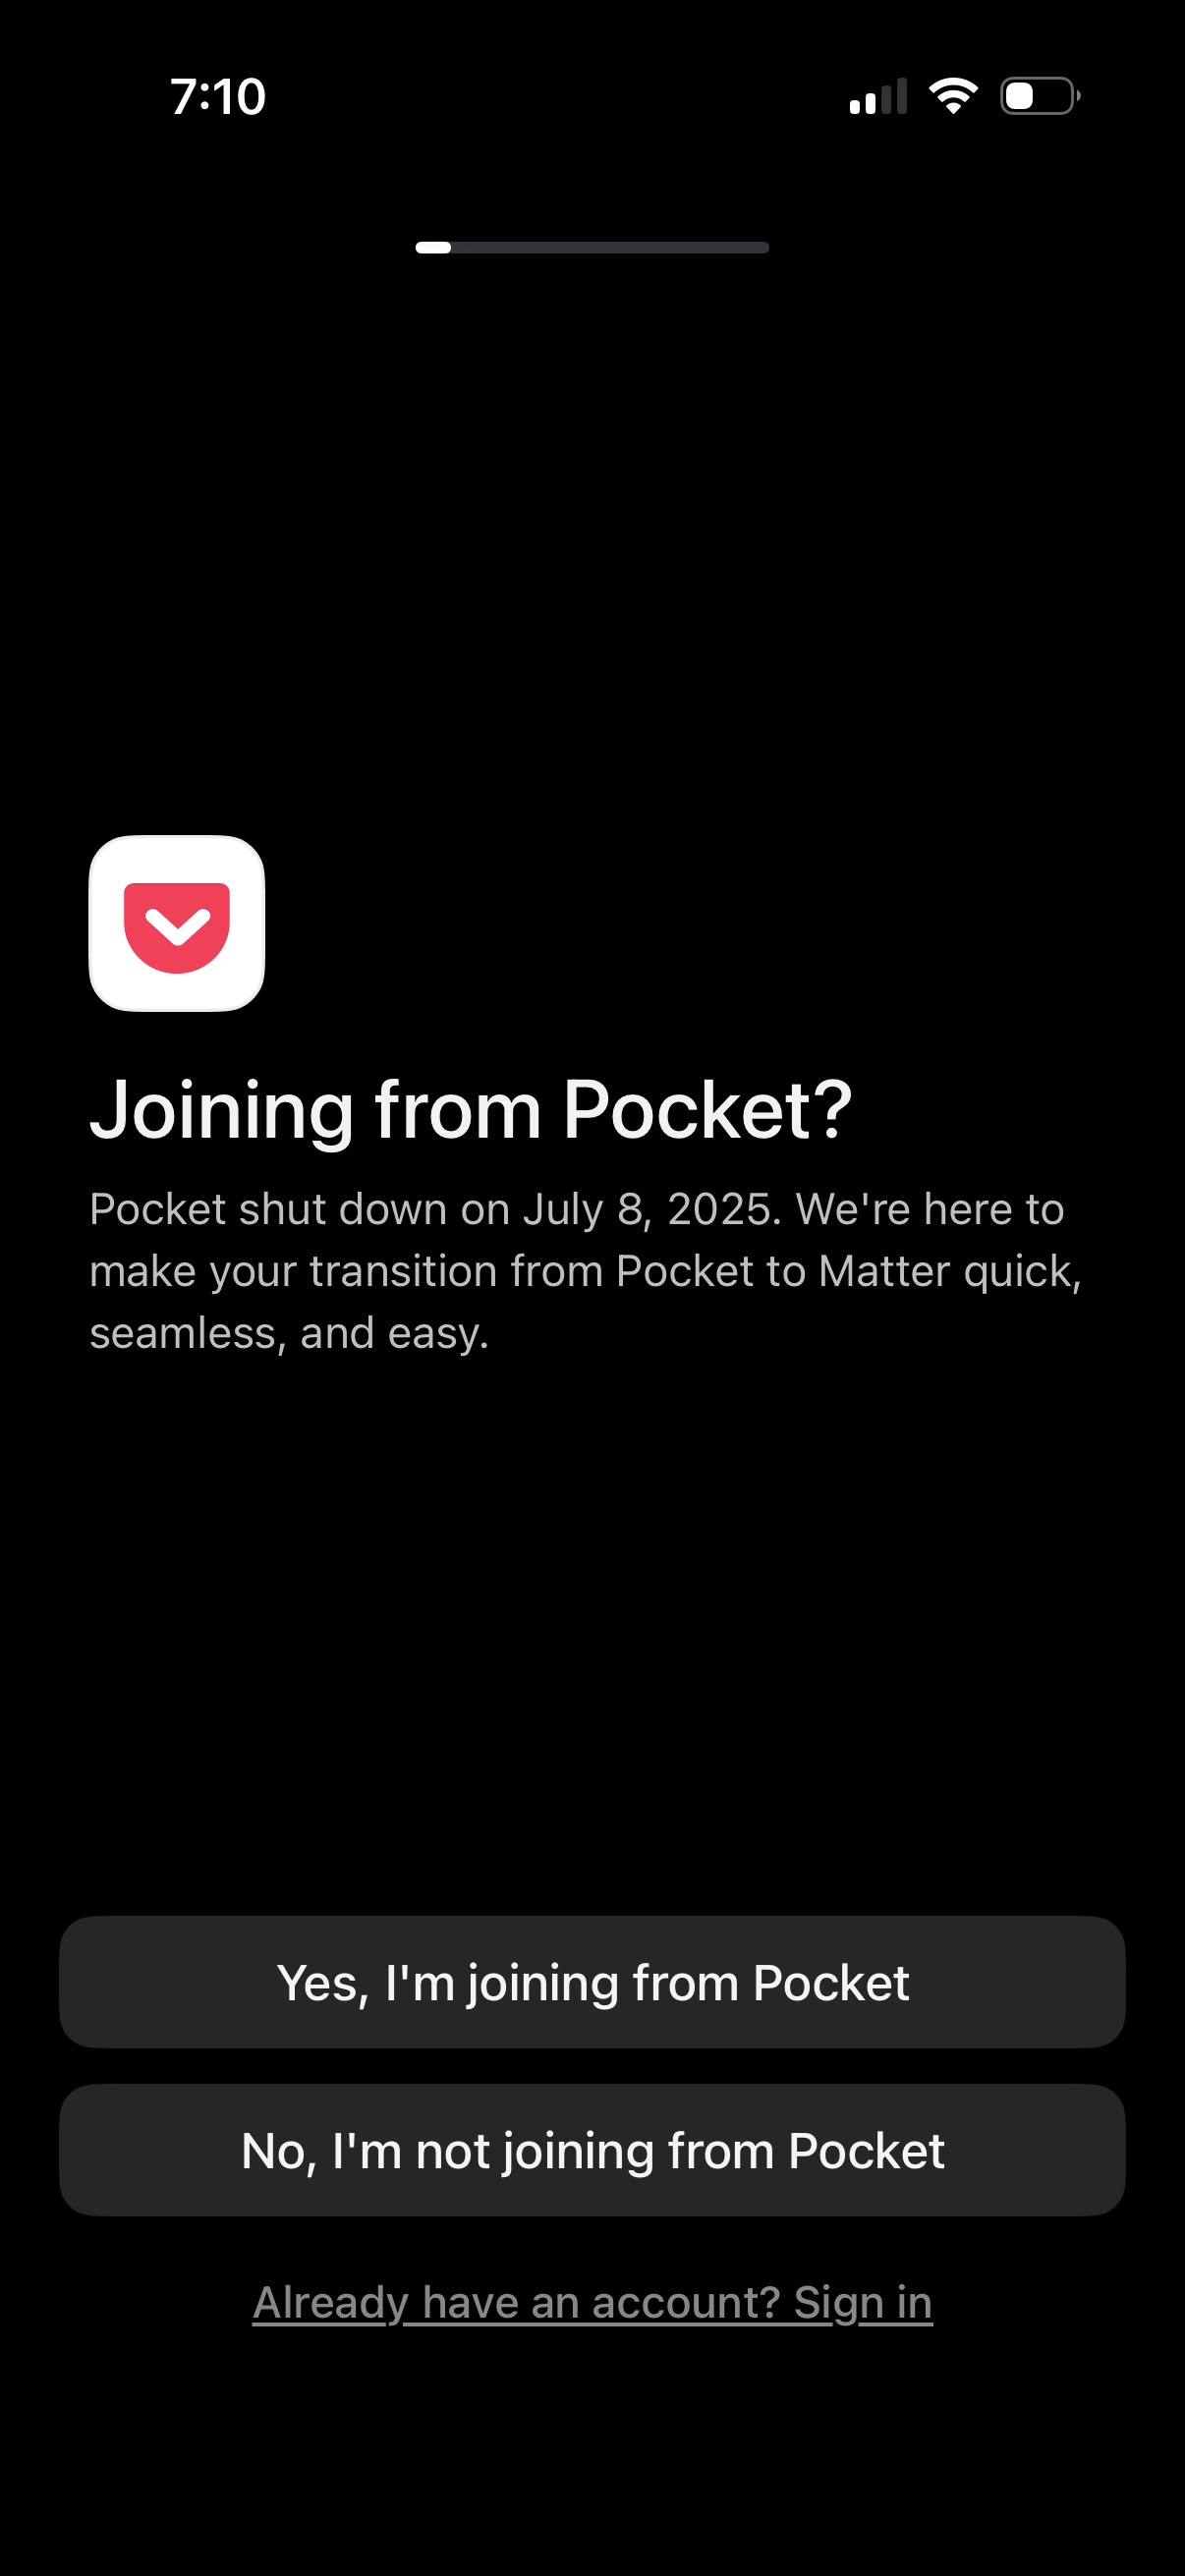
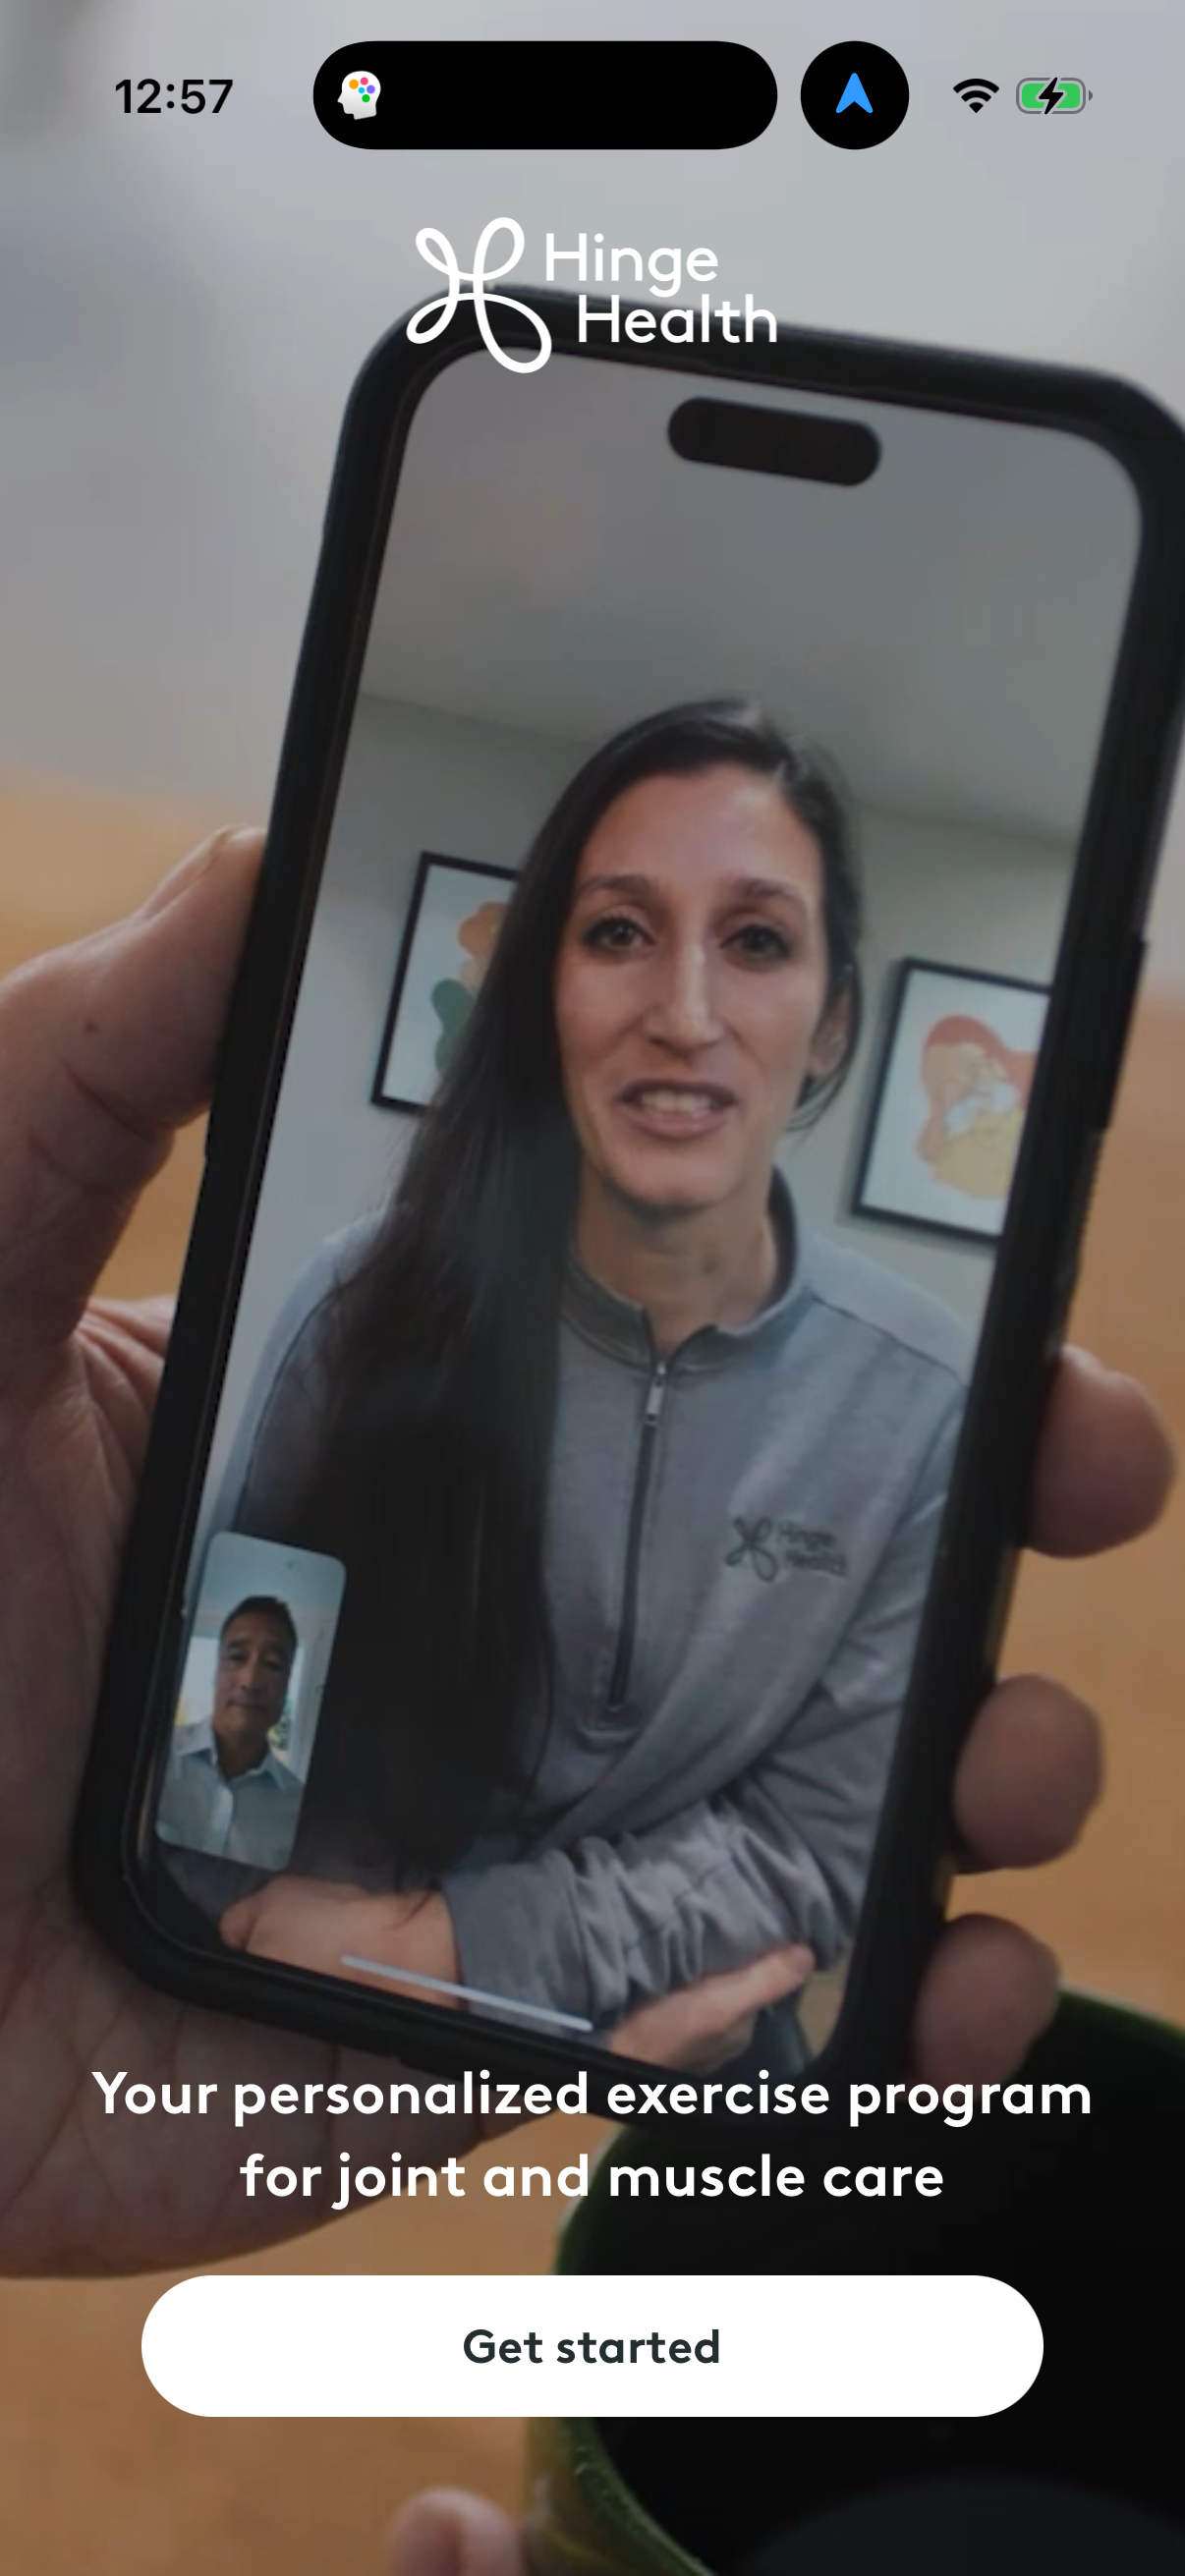
The broad matcher sweeps in "get started" welcome buttons (e.g. tags like 'get started screen') that are single-CTA splash screens, not the multi-step "3 of 5 tasks complete" checklists teams actually mean. If a competitor claims "half of apps use setup checklists," they are almost certainly counting welcome screens.
Who actually builds them
Among the 107 checklist apps, the pattern concentrates in a few categories with enough companies to be meaningful [3]:
| Category | Apps with a checklist |
|---|---|
| Health & Fitness | 19 |
| News | 10 |
| Productivity | 8 |
Only these three clear N>=8; all other categories (Shopping 7, Travel 7, Education 7, Finance 6, and below) are too thin for per-category rates and should be read as absolute counts only [3]. Named examples ranked by screenshot count include finch (26), kahoot (20), quizlet (16), speechify (15), and duolingo (8) [4].
How to apply it
If you are in Health & Fitness, News, or Productivity, a setup checklist is a well-trodden pattern with peers to benchmark against. Outside those categories it is comparatively rare, so shipping one is a differentiator rather than a convention-match — weigh the build cost accordingly. Do not justify the investment with the 51% figure; the honest peer prevalence is 13%.
Caveats
The 13% is a tag-match lower bound: apps with a checklist that was never screenshotted or never tagged 'checklist' are missed [1]. Category counts below N=8 are absolute counts only, never percentages [3]. Screenshot counts per app (e.g. finch's 26) reflect how many captured screens carried the tag, not usage frequency [4].
The numbers
| Stat | Computed from |
|---|---|
| 107 apps / 13% (0.132) with checklist-tagged screen | setup_checklist_strict 107 companies; setup_checklist_strict_pct 0.132 = 107/809 |
| 413 apps / 51% broad matcher (inflated, do not headline) | pattern_prevalence_by_company setup_checklist_broad 413 companies; 413/809=0.51; flagged OVERBROAD |
| Health & Fitness 19, News 10, Productivity 8 apps with checklists (only N>=8) | checklist_by_category: Health & Fitness 19, News 10, Productivity 8; Shopping/Travel/Education 7 each, Finance 6, etc. (N<8) |
| finch 26, kahoot 20, quizlet 16, speechify 15, duolingo 8 checklist screenshots | qualitative named_examples setup_checklist ranked by screenshot count |
Sources & citations
- [1] Lazyweb Research analysis of 809 tracked apps (mobile-app screenshot corpus), July 2026. Strict checklist matcher: screenshots whose tags contain 'checklist', deduped by company. ↩
- [2] Lazyweb Research analysis of 809 tracked apps (mobile-app screenshot corpus), July 2026. Broad matcher adds 'get started'/'getting started' tags; flagged as inflated by welcome-screen CTAs. ↩
- [3] Lazyweb Research analysis of 107 checklist apps (mobile-app screenshot corpus), July 2026. Company counts by app-store category; only Health & Fitness, News, Productivity clear N>=8. ↩
- [4] Lazyweb Research analysis of 107 checklist apps (mobile-app screenshot corpus), July 2026. Named examples ranked by checklist-tagged screenshot count. ↩
Source: Lazyweb Research — proprietary analysis of real, in-market app screens. Cite as Lazyweb Research, 2026-07-07.