Sample content vs social seeding: which empty-state fill pattern is more common?
Sample or demo content is the more common way to fill an empty product: 100 apps use it (1,331 screenshots) versus 64 apps for social seeding (230 screenshots) [1]. Sample content leads in editor and creation apps; social seeding leads in feed and network apps [2]. Both trail the plain empty state (373 apps), so they are differentiators, not defaults [3].
Sample content appears in 100 apps vs social seeding in 64 — sample content is the more common empty-state fill — Lazyweb Research, July 2026.
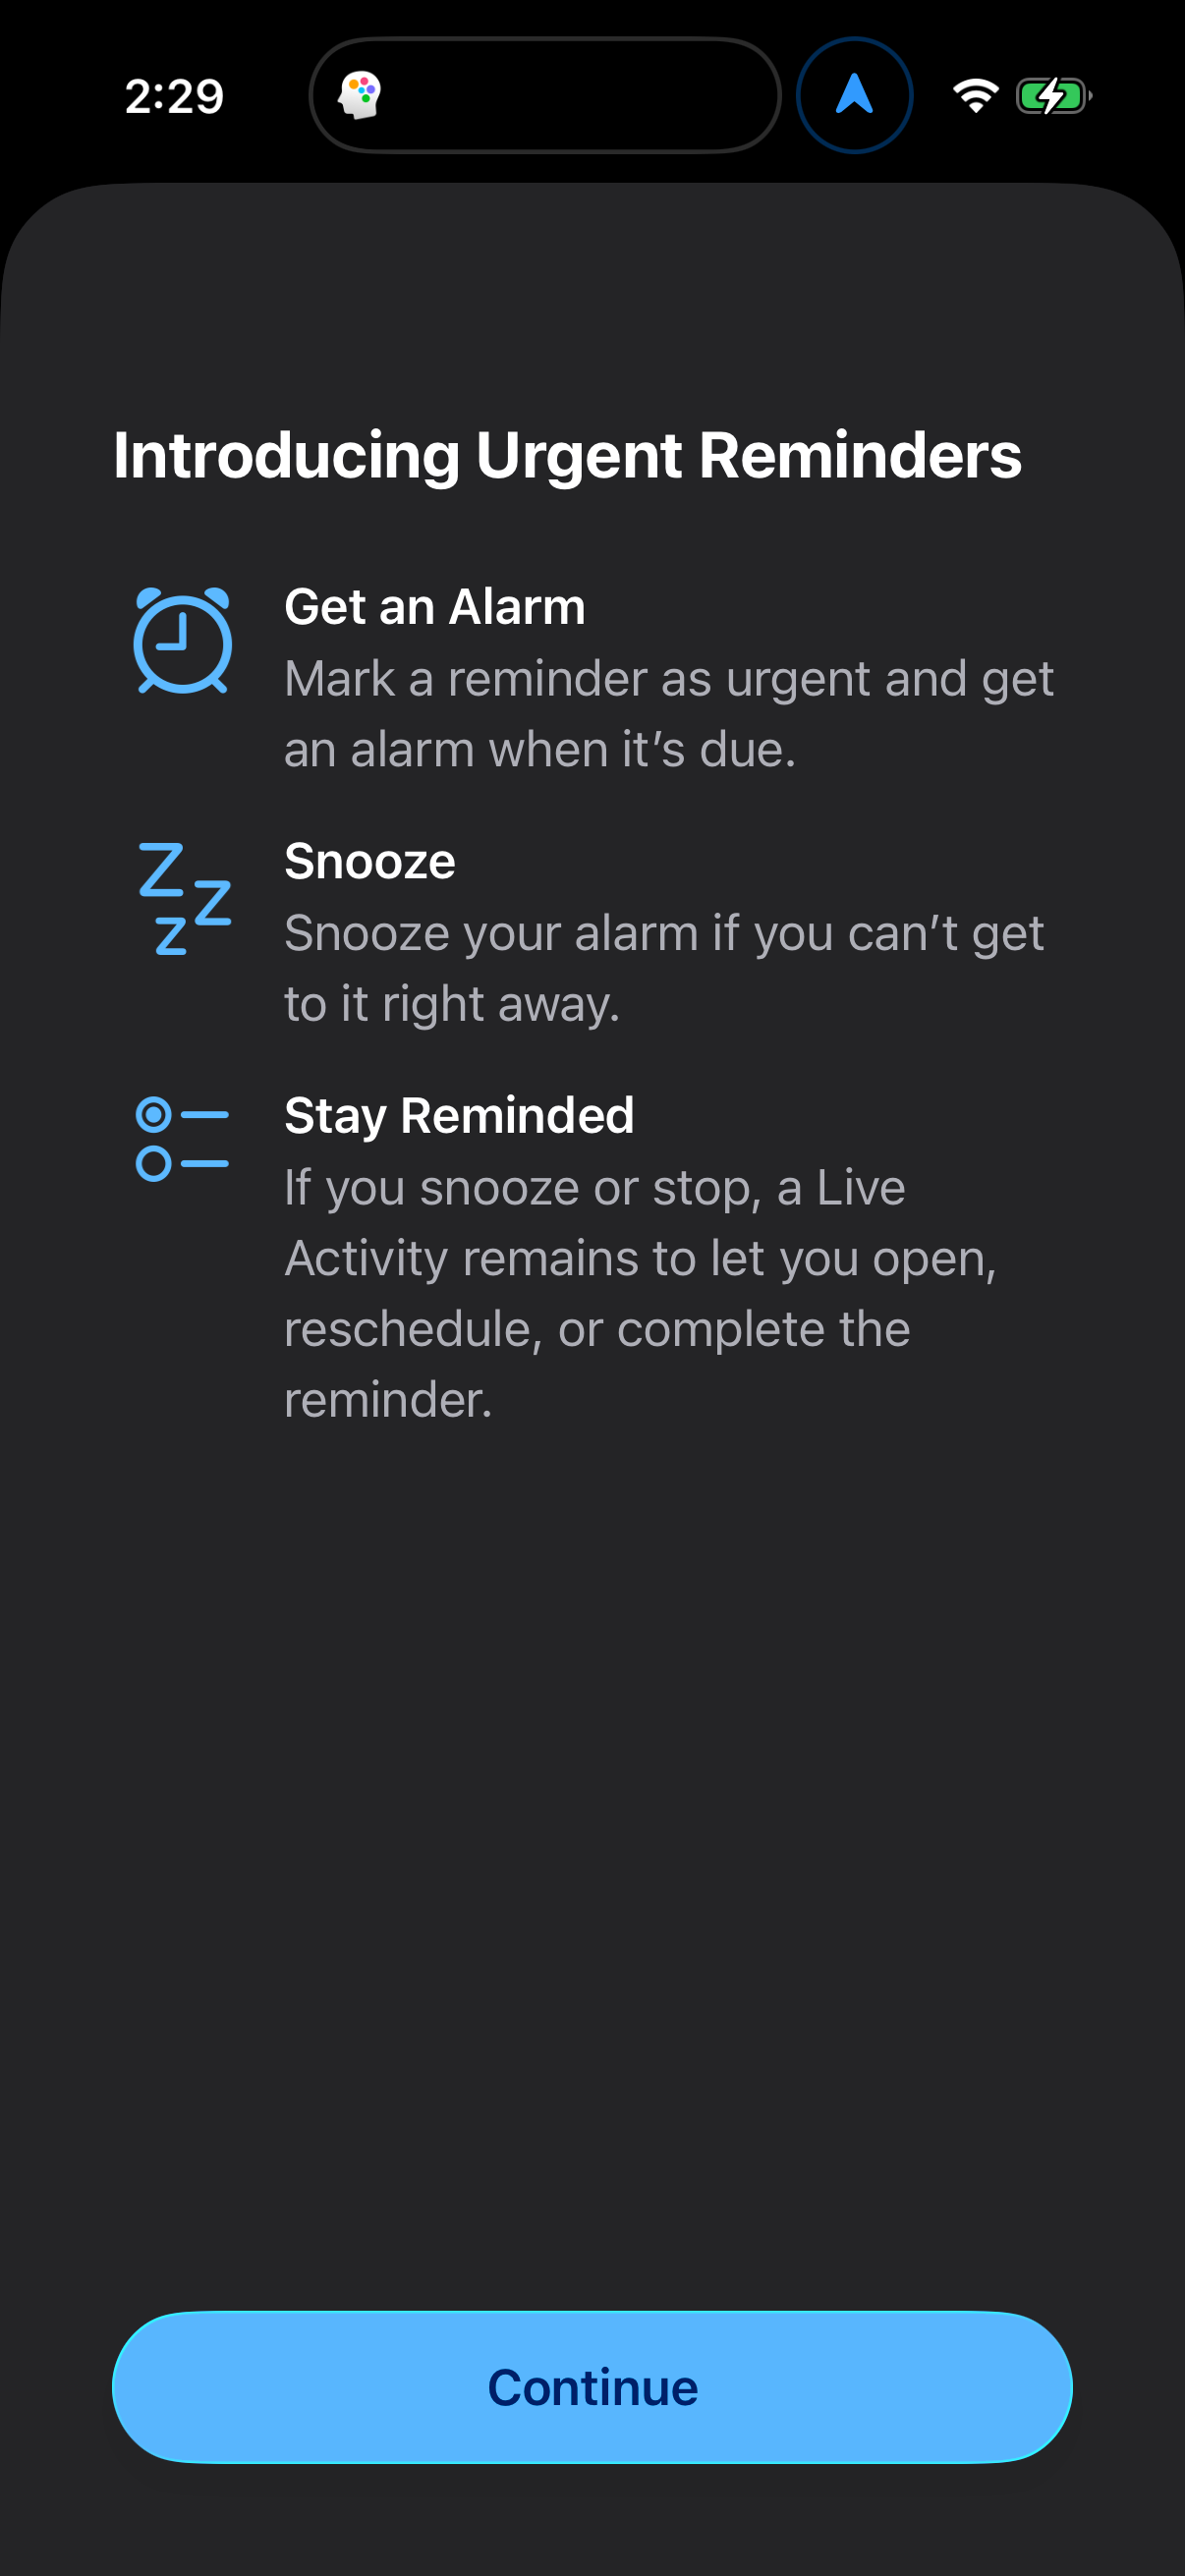
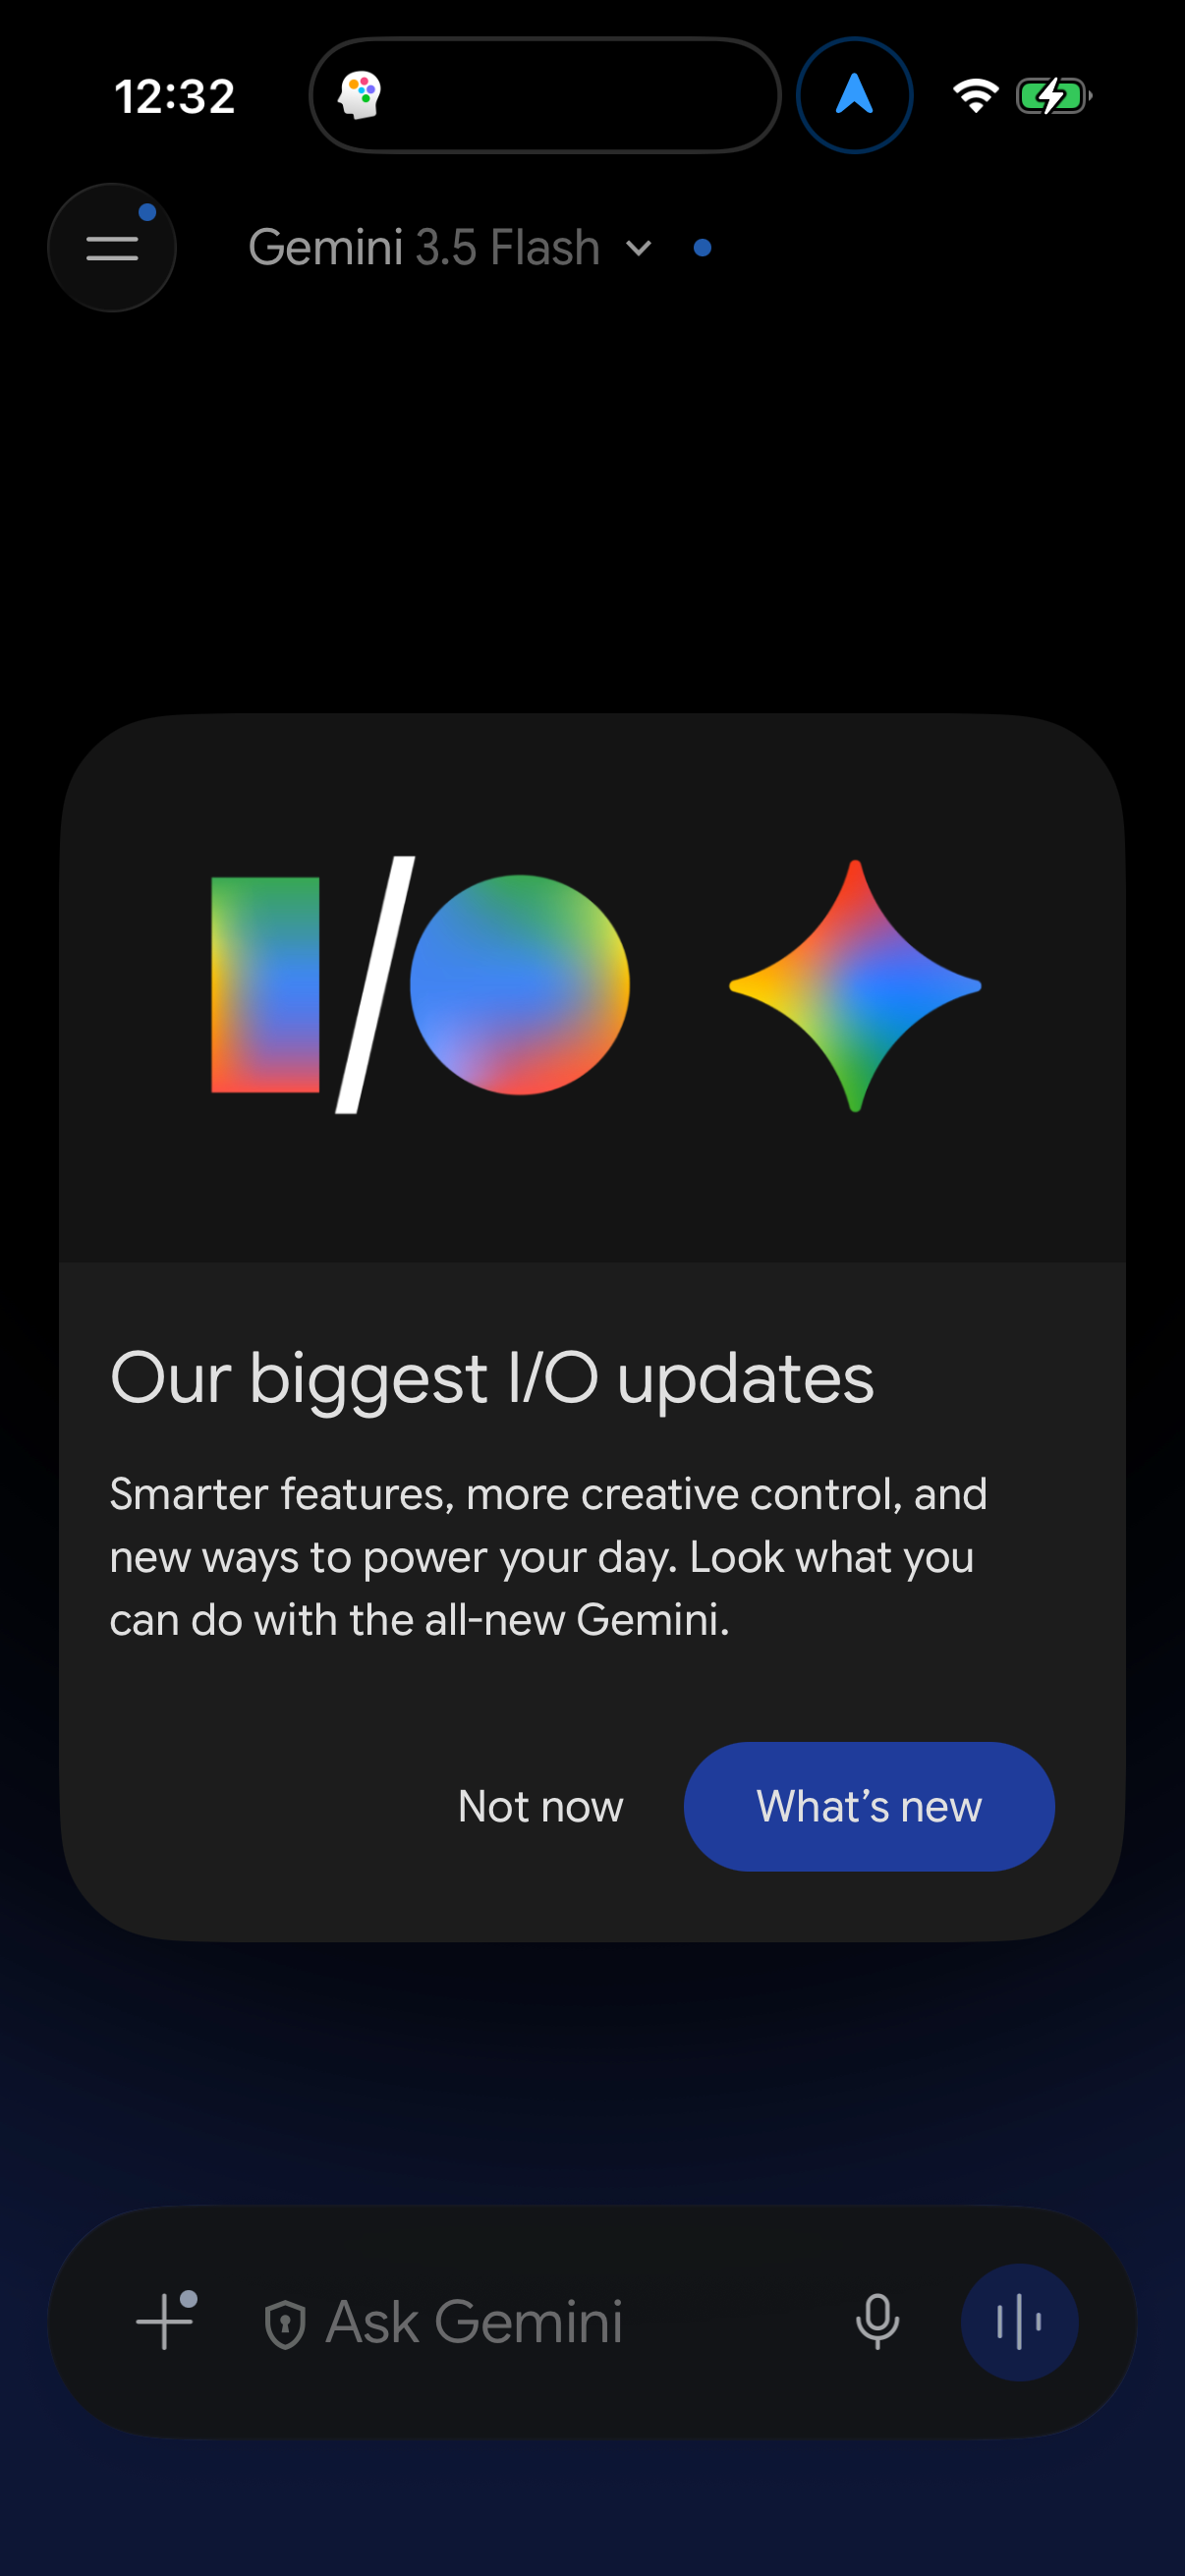
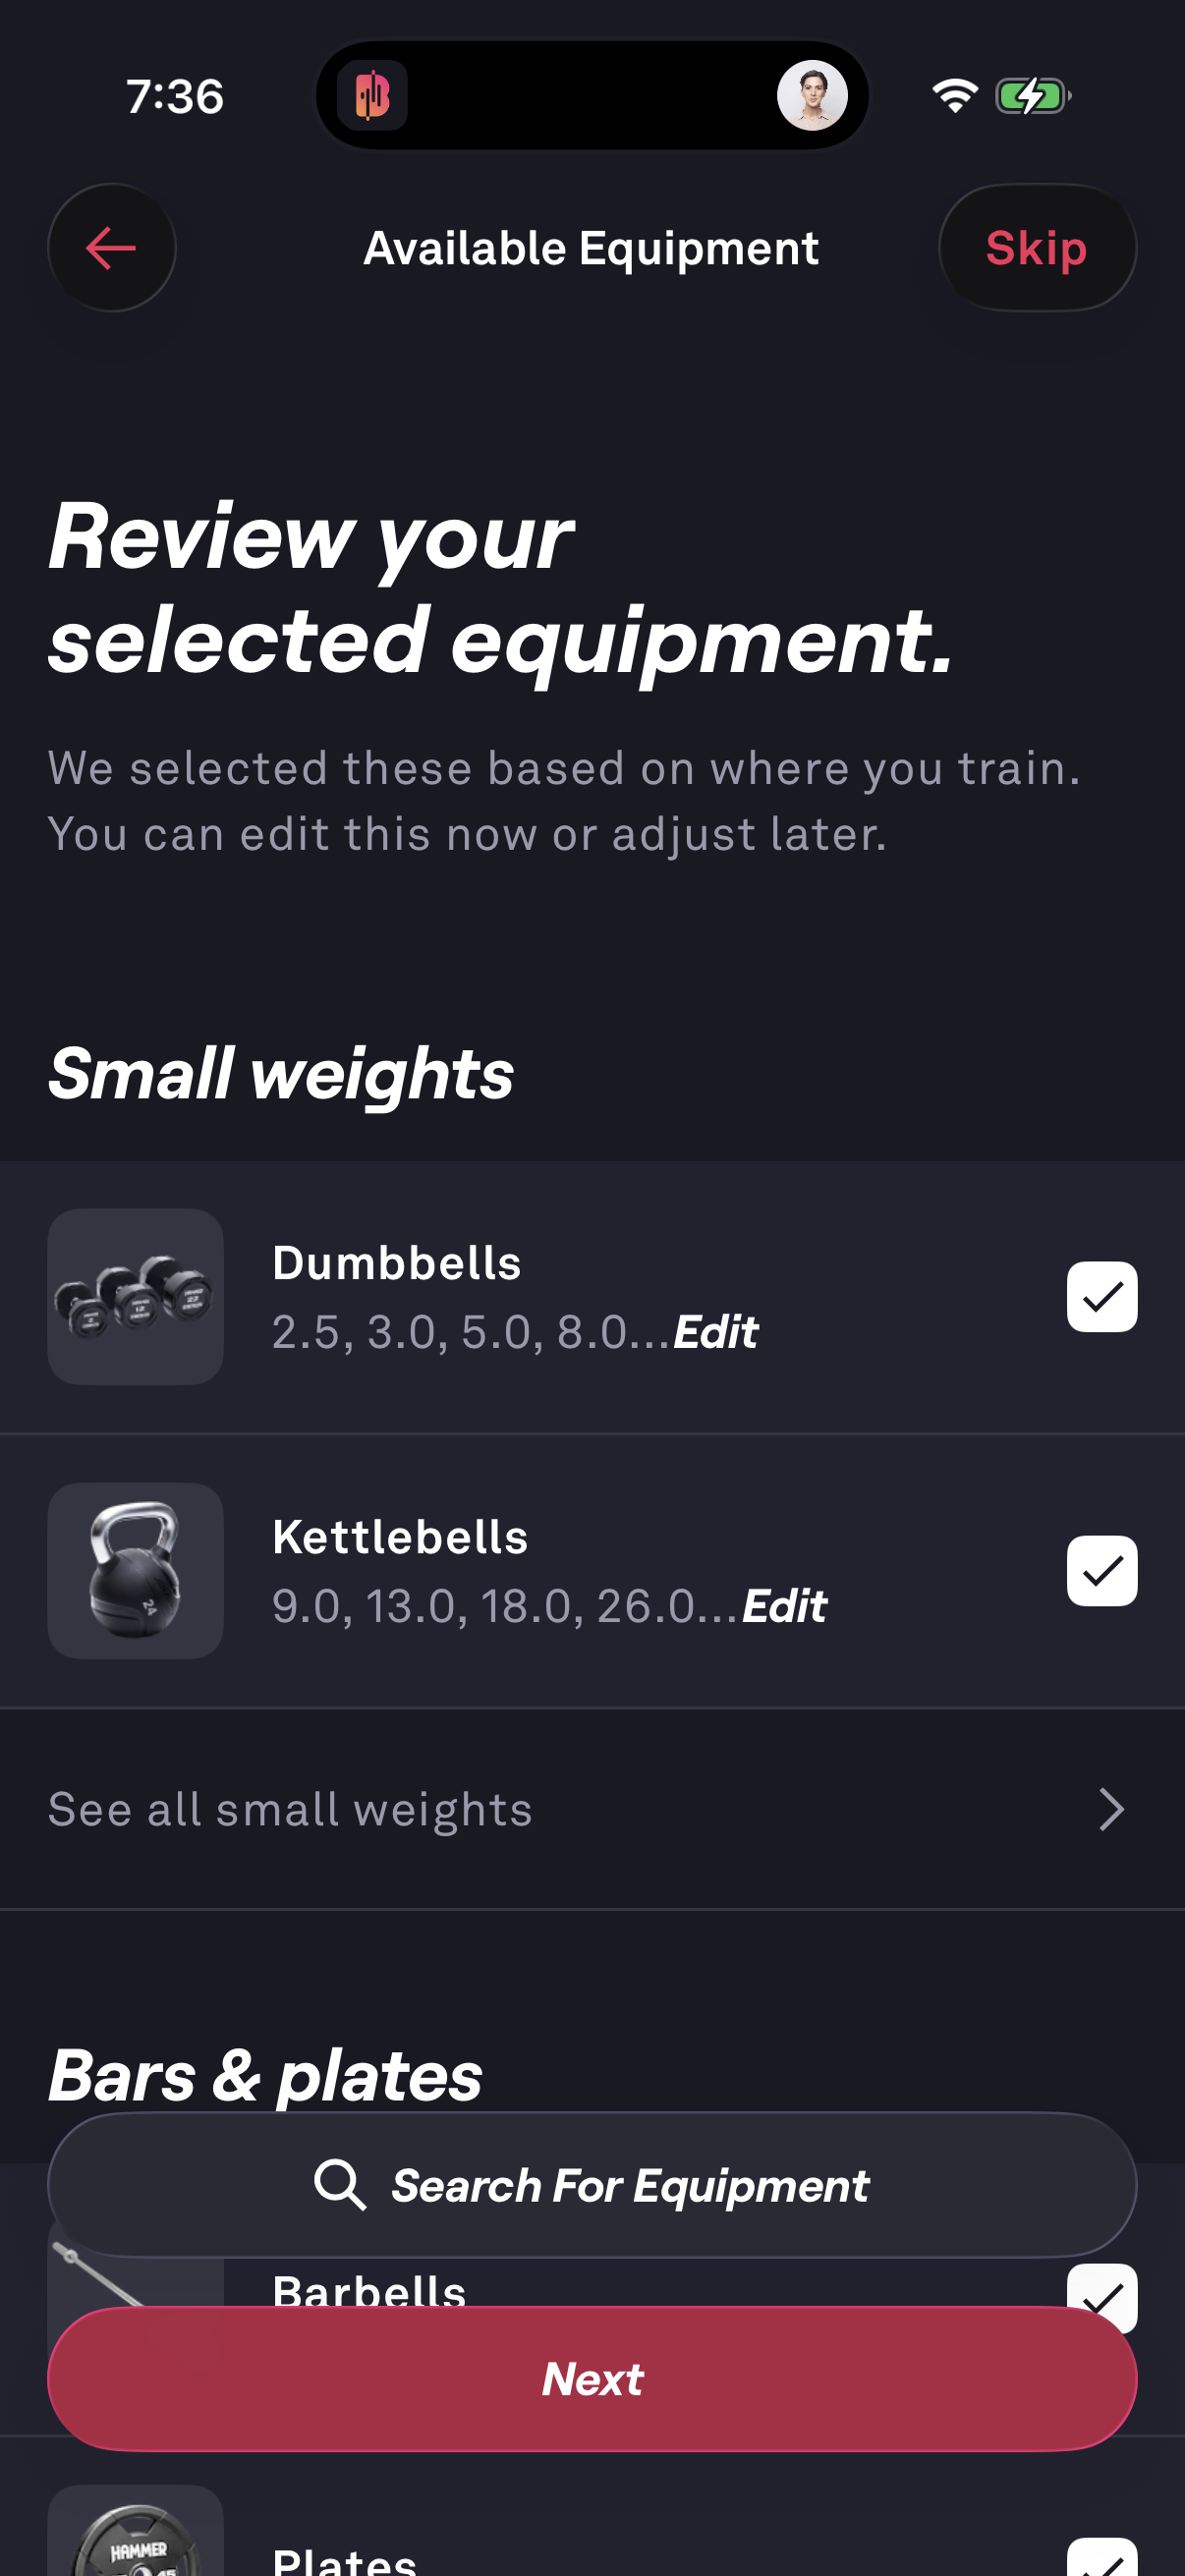
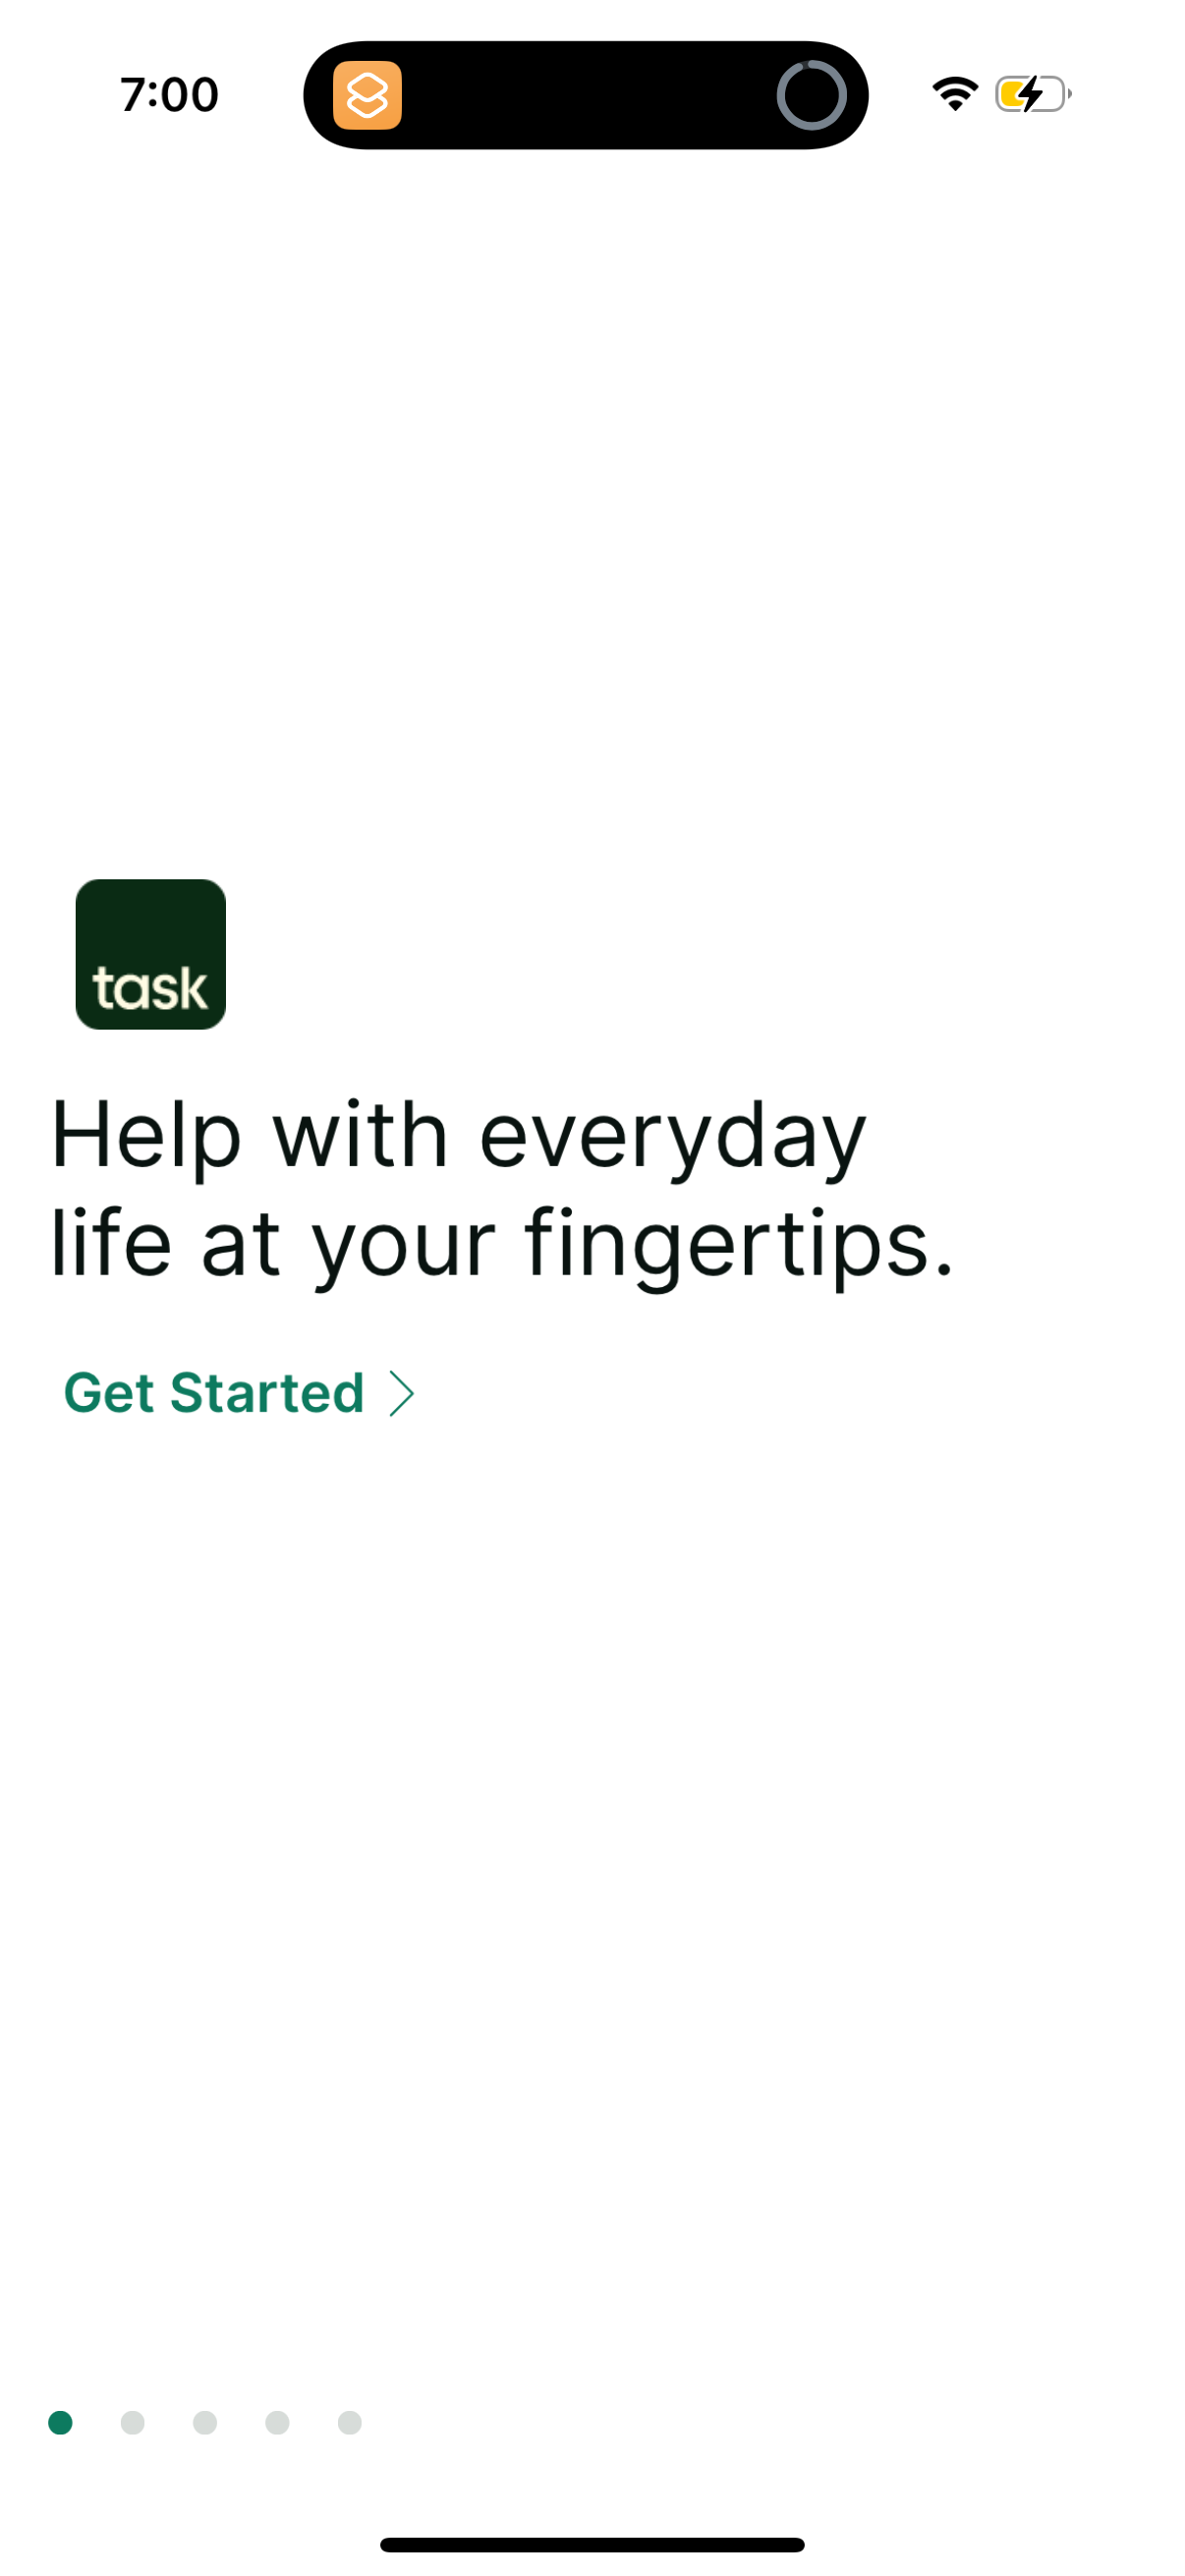
The head-to-head
When teams decide to fill an empty surface rather than just label it, the two dominant approaches split like this [1]:
| Pattern | Apps | Screenshots |
|---|---|---|
| Sample / demo content | 100 | 1,331 |
| Social seeding | 64 | 230 |
Sample content wins on both dimensions, and its screenshot-per-app density (13.3) is far higher than social seeding's (3.6), meaning apps that use demo content lean on it across many screens rather than a single splash.
They serve different product shapes
The choice is driven by product type, not preference [2]. Sample-content apps are overwhelmingly creation/editor tools where a blank canvas is the enemy: adobe, canva, capcut, pages, replit, wix, and kahoot all seed templates or example projects. Social-seeding apps are feed/network products where an empty timeline is the enemy: snapchat, goodreads, strava, signal, whatnot, and peloton all push suggested follows or find-friends. If your empty surface is a canvas, sample content is the peer convention; if it is a feed, social seeding is.
How to apply it
Match the fill to the void. A creation tool with no social graph gains little from "find friends" but a lot from a starter template; a social feed gains little from demo posts but a lot from suggested follows. Because both patterns sit well below the 373-app empty-state baseline [3], adopting the right one is a way to stand out — most competitors will just show "nothing here yet."
Caveats
All three counts are tag-match lower bounds and deduped by company [1][3]. The named examples illustrate product-type fit but are not an exhaustive census. Screenshot counts reflect captured/tagged screens, not runtime frequency, so the 13.3-vs-3.6 density gap describes the corpus, not necessarily user exposure [1].
The numbers
| Stat | Computed from |
|---|---|
| Sample content 100 apps / 1,331 screenshots; social seeding 64 apps / 230 screenshots | pattern_prevalence_by_company: sample_content 100 companies (1331 shots), social_seeding 64 companies (230 shots); density 1331/100=13.3, 230/64=3.6 |
| Sample-content apps: adobe, canva, capcut, pages, replit, wix, kahoot; social-seeding apps: snapchat, goodreads, strava, signal, whatnot, peloton | qualitative named_examples sample_content and social_seeding |
| Plain empty state baseline 373 apps | pattern_prevalence_by_company empty_state 373 companies |
Sources & citations
- [1] Lazyweb Research analysis of 809 tracked apps (mobile-app screenshot corpus), July 2026. Sample-content and social-seeding prevalence deduped by company via tag match. ↩
- [2] Lazyweb Research analysis of 809 tracked apps (mobile-app screenshot corpus), July 2026. Named examples grouped by product type for each pattern. ↩
- [3] Lazyweb Research analysis of 809 tracked apps (mobile-app screenshot corpus), July 2026. Plain empty-state baseline: 373 companies. ↩
Source: Lazyweb Research — proprietary analysis of real, in-market app screens. Cite as Lazyweb Research, 2026-07-07.