How Many Onboarding Screens Do Social Networking Apps Have?
Across 10 tracked Social Networking onboarding flows (10 companies), the median is 11.5 screens and the average is 11.6 [1] — in line with the 11-screen all-category median [2]. Lengths range from 2 to 21 screens [1]. This is a small sample reported with explicit n.
Social Networking apps run a median 11.5 onboarding screens, matching the all-category median of 11 (n=10 flows, July 2026).
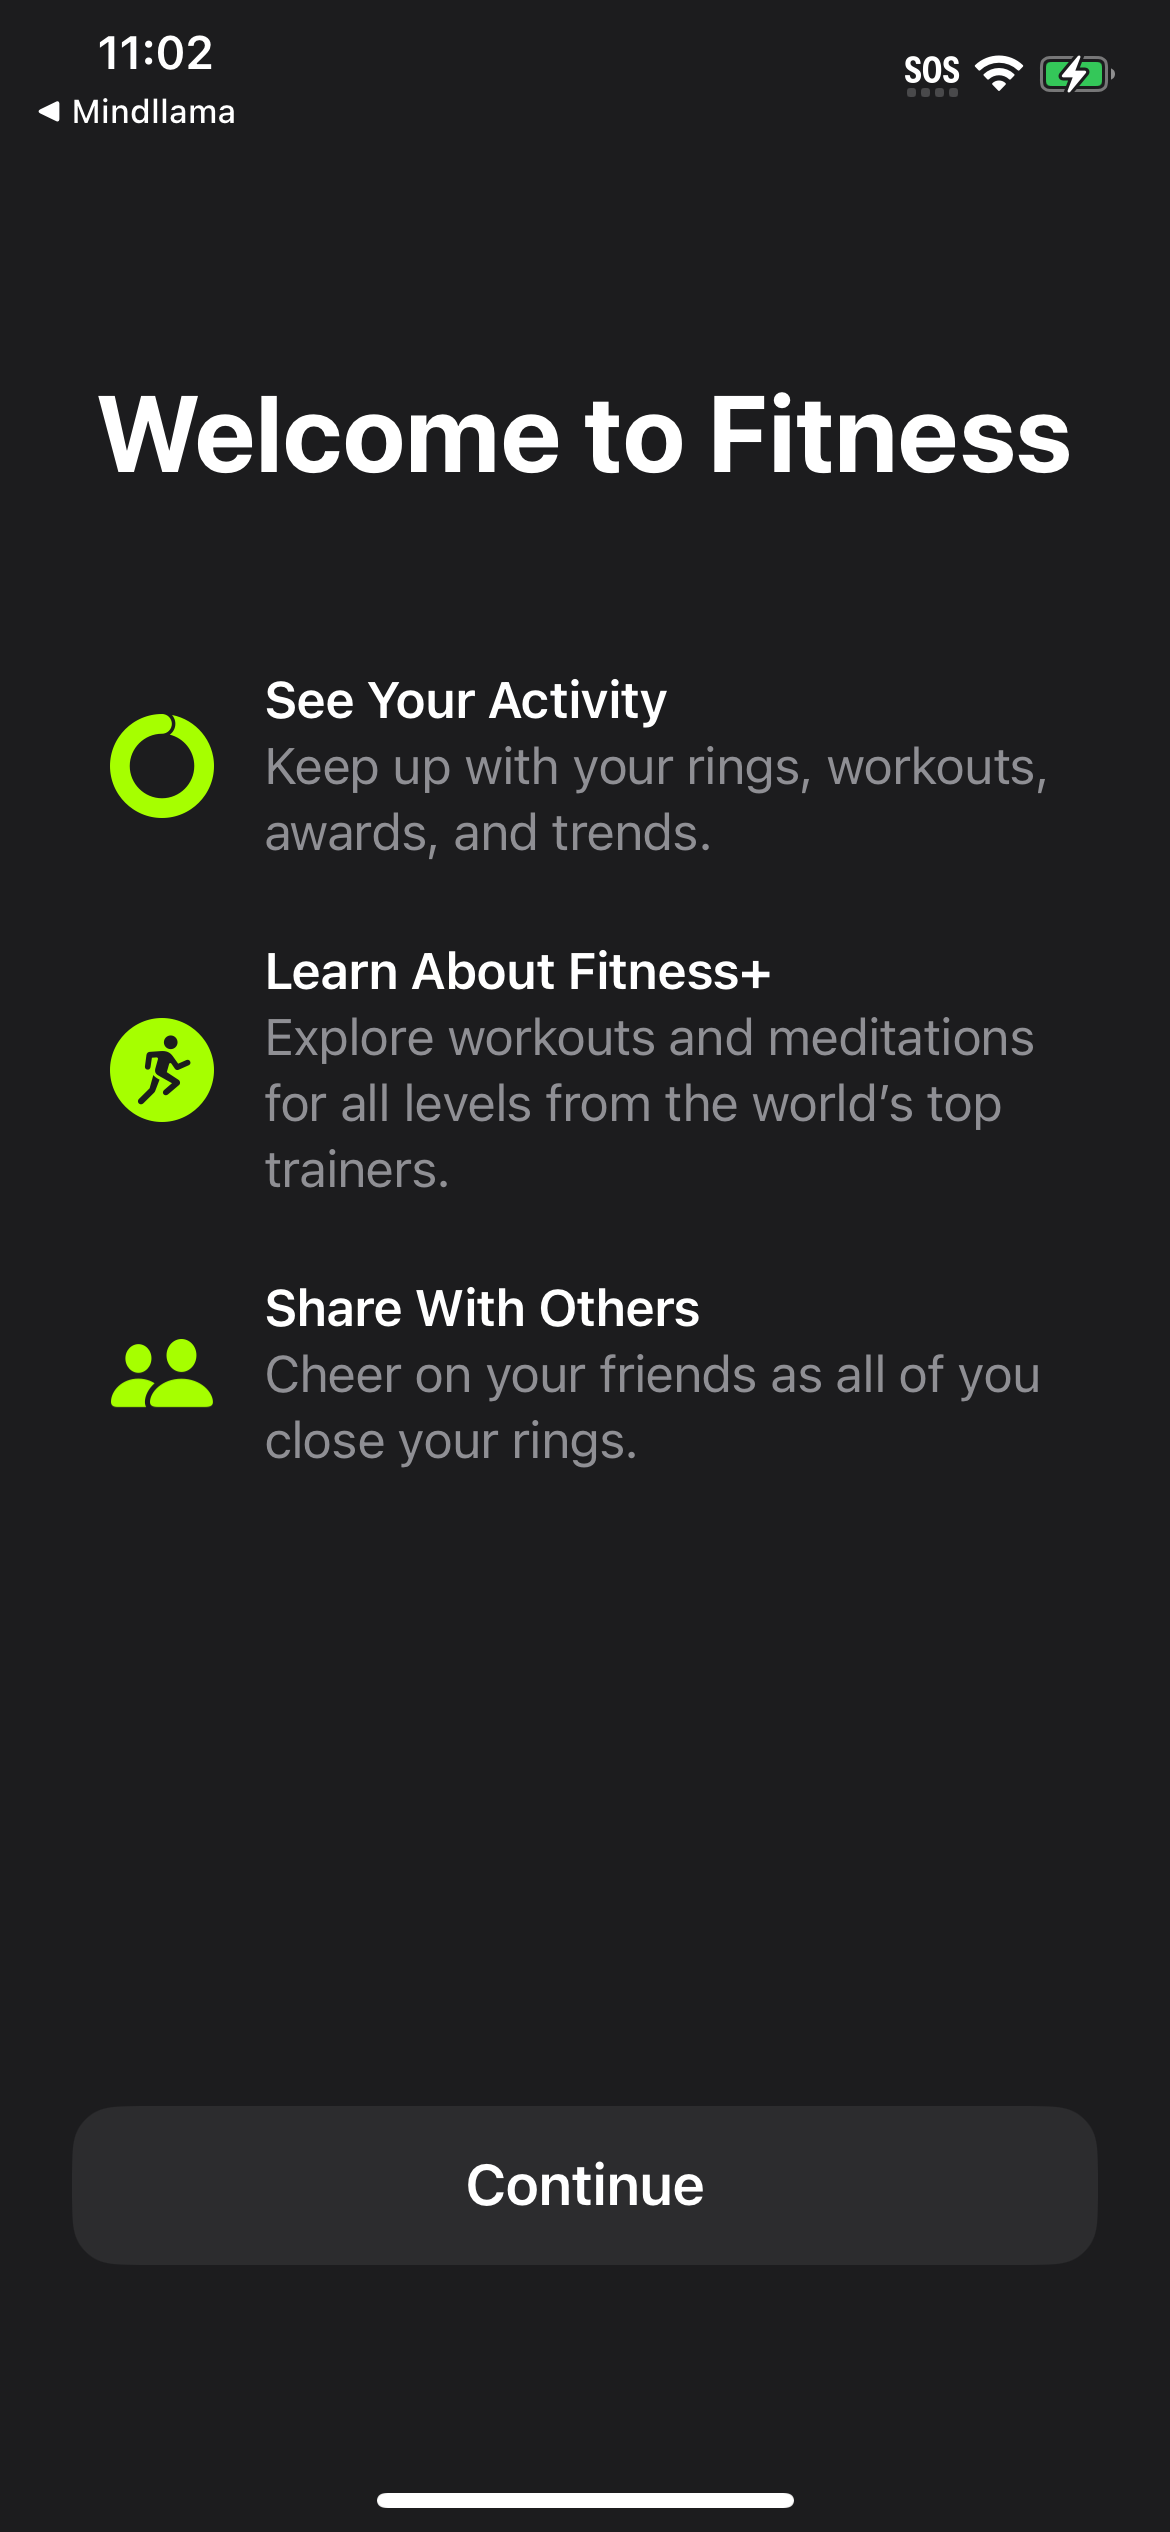
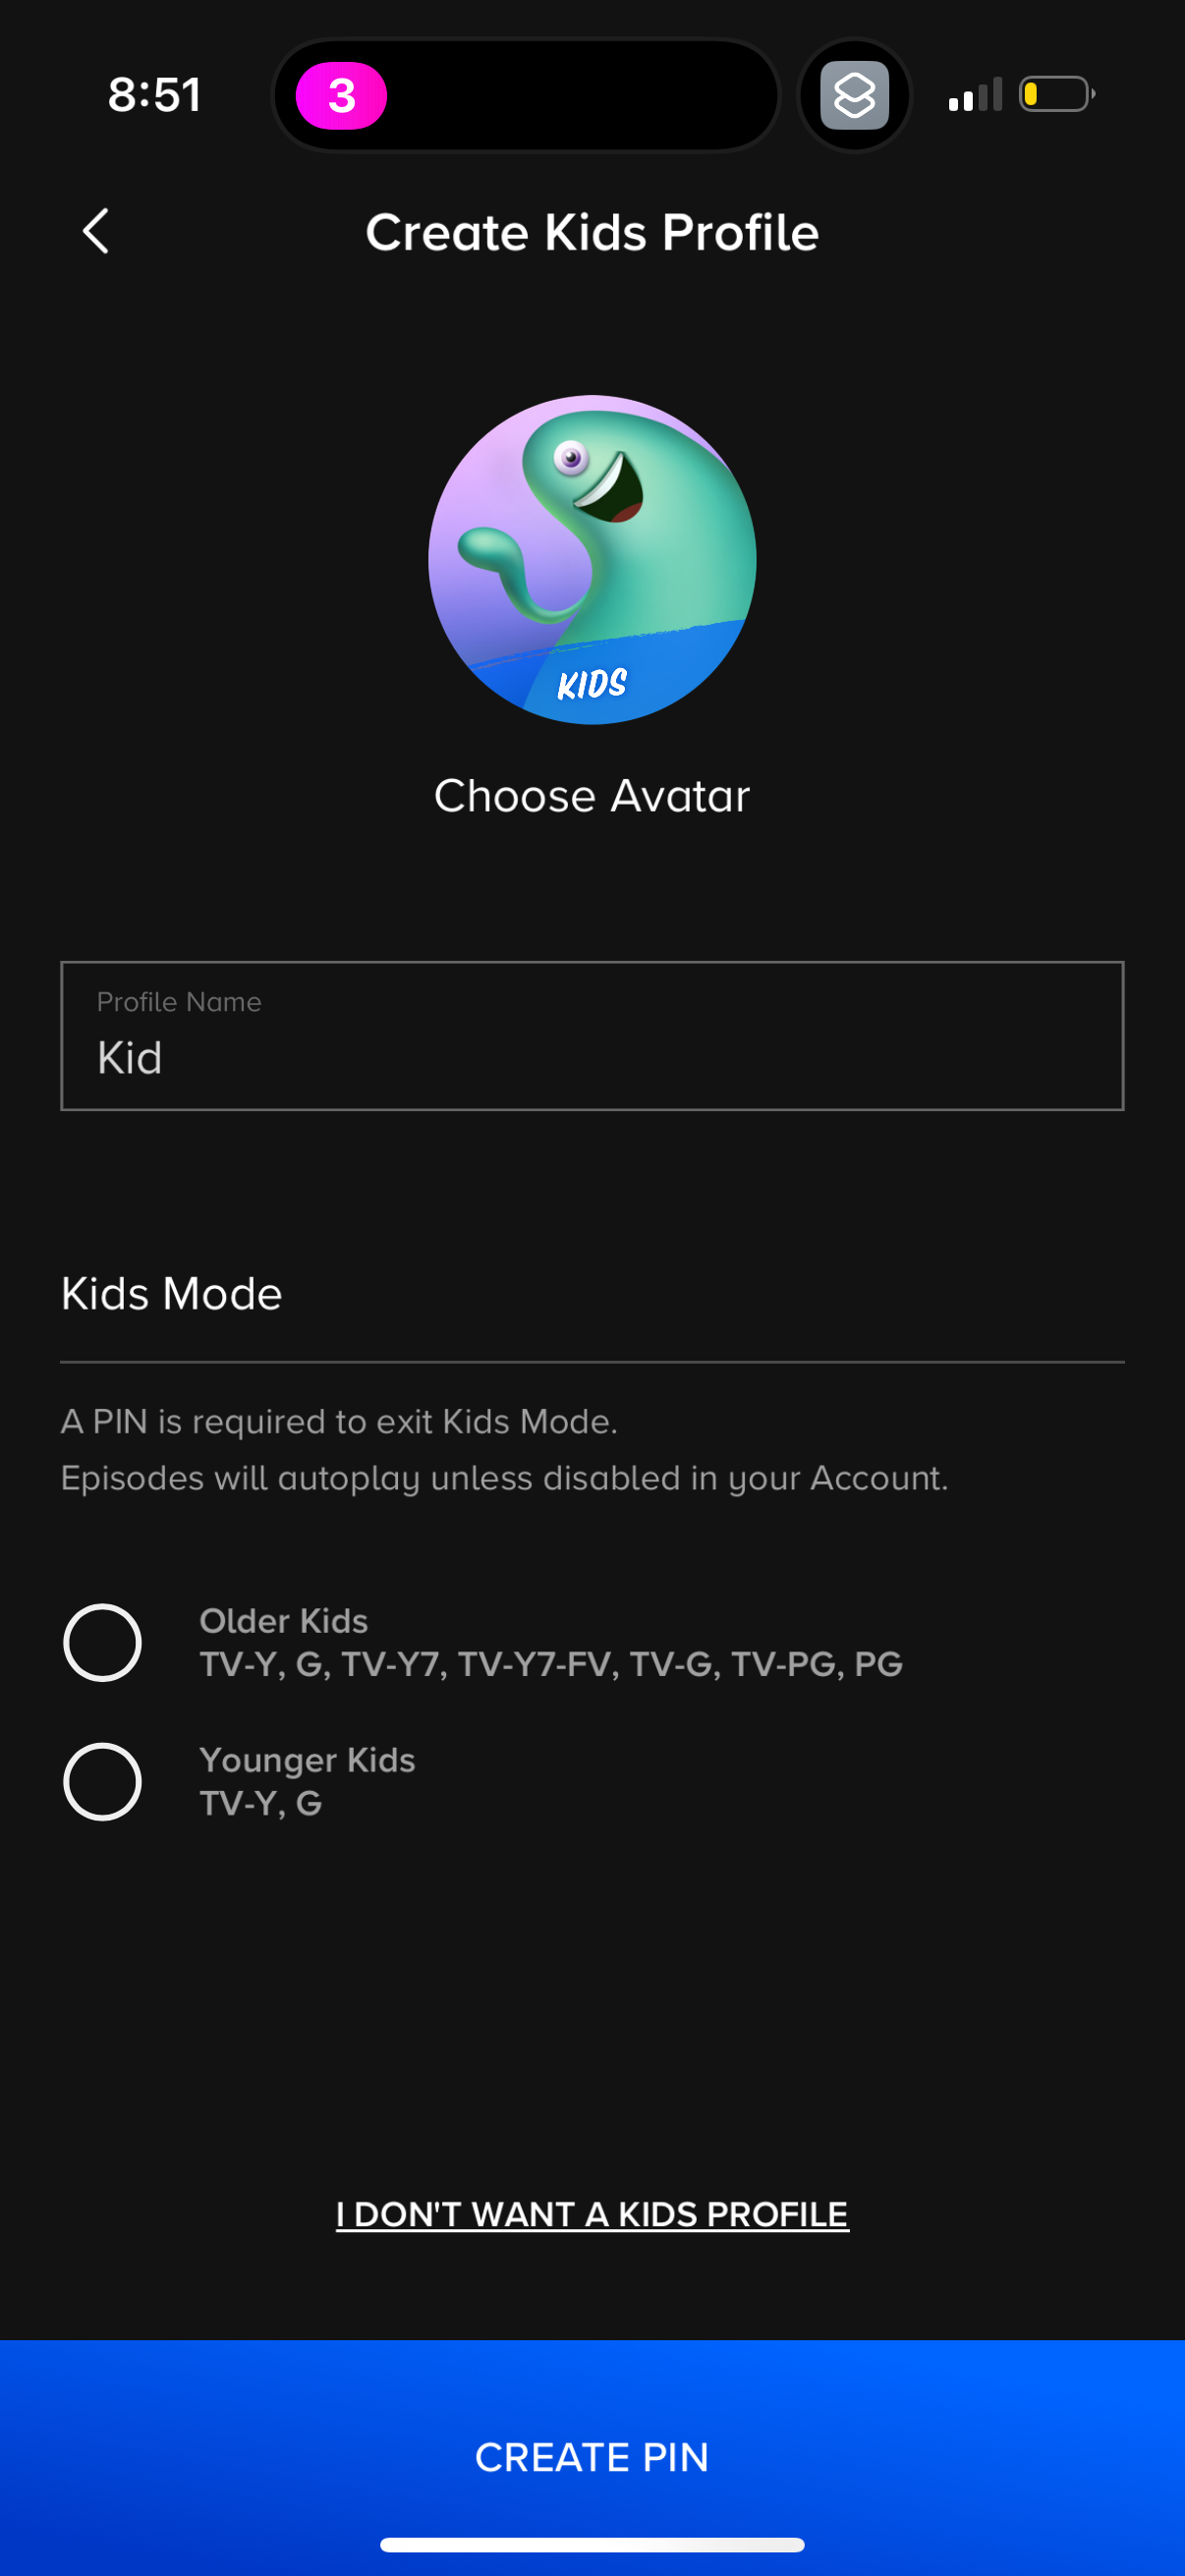
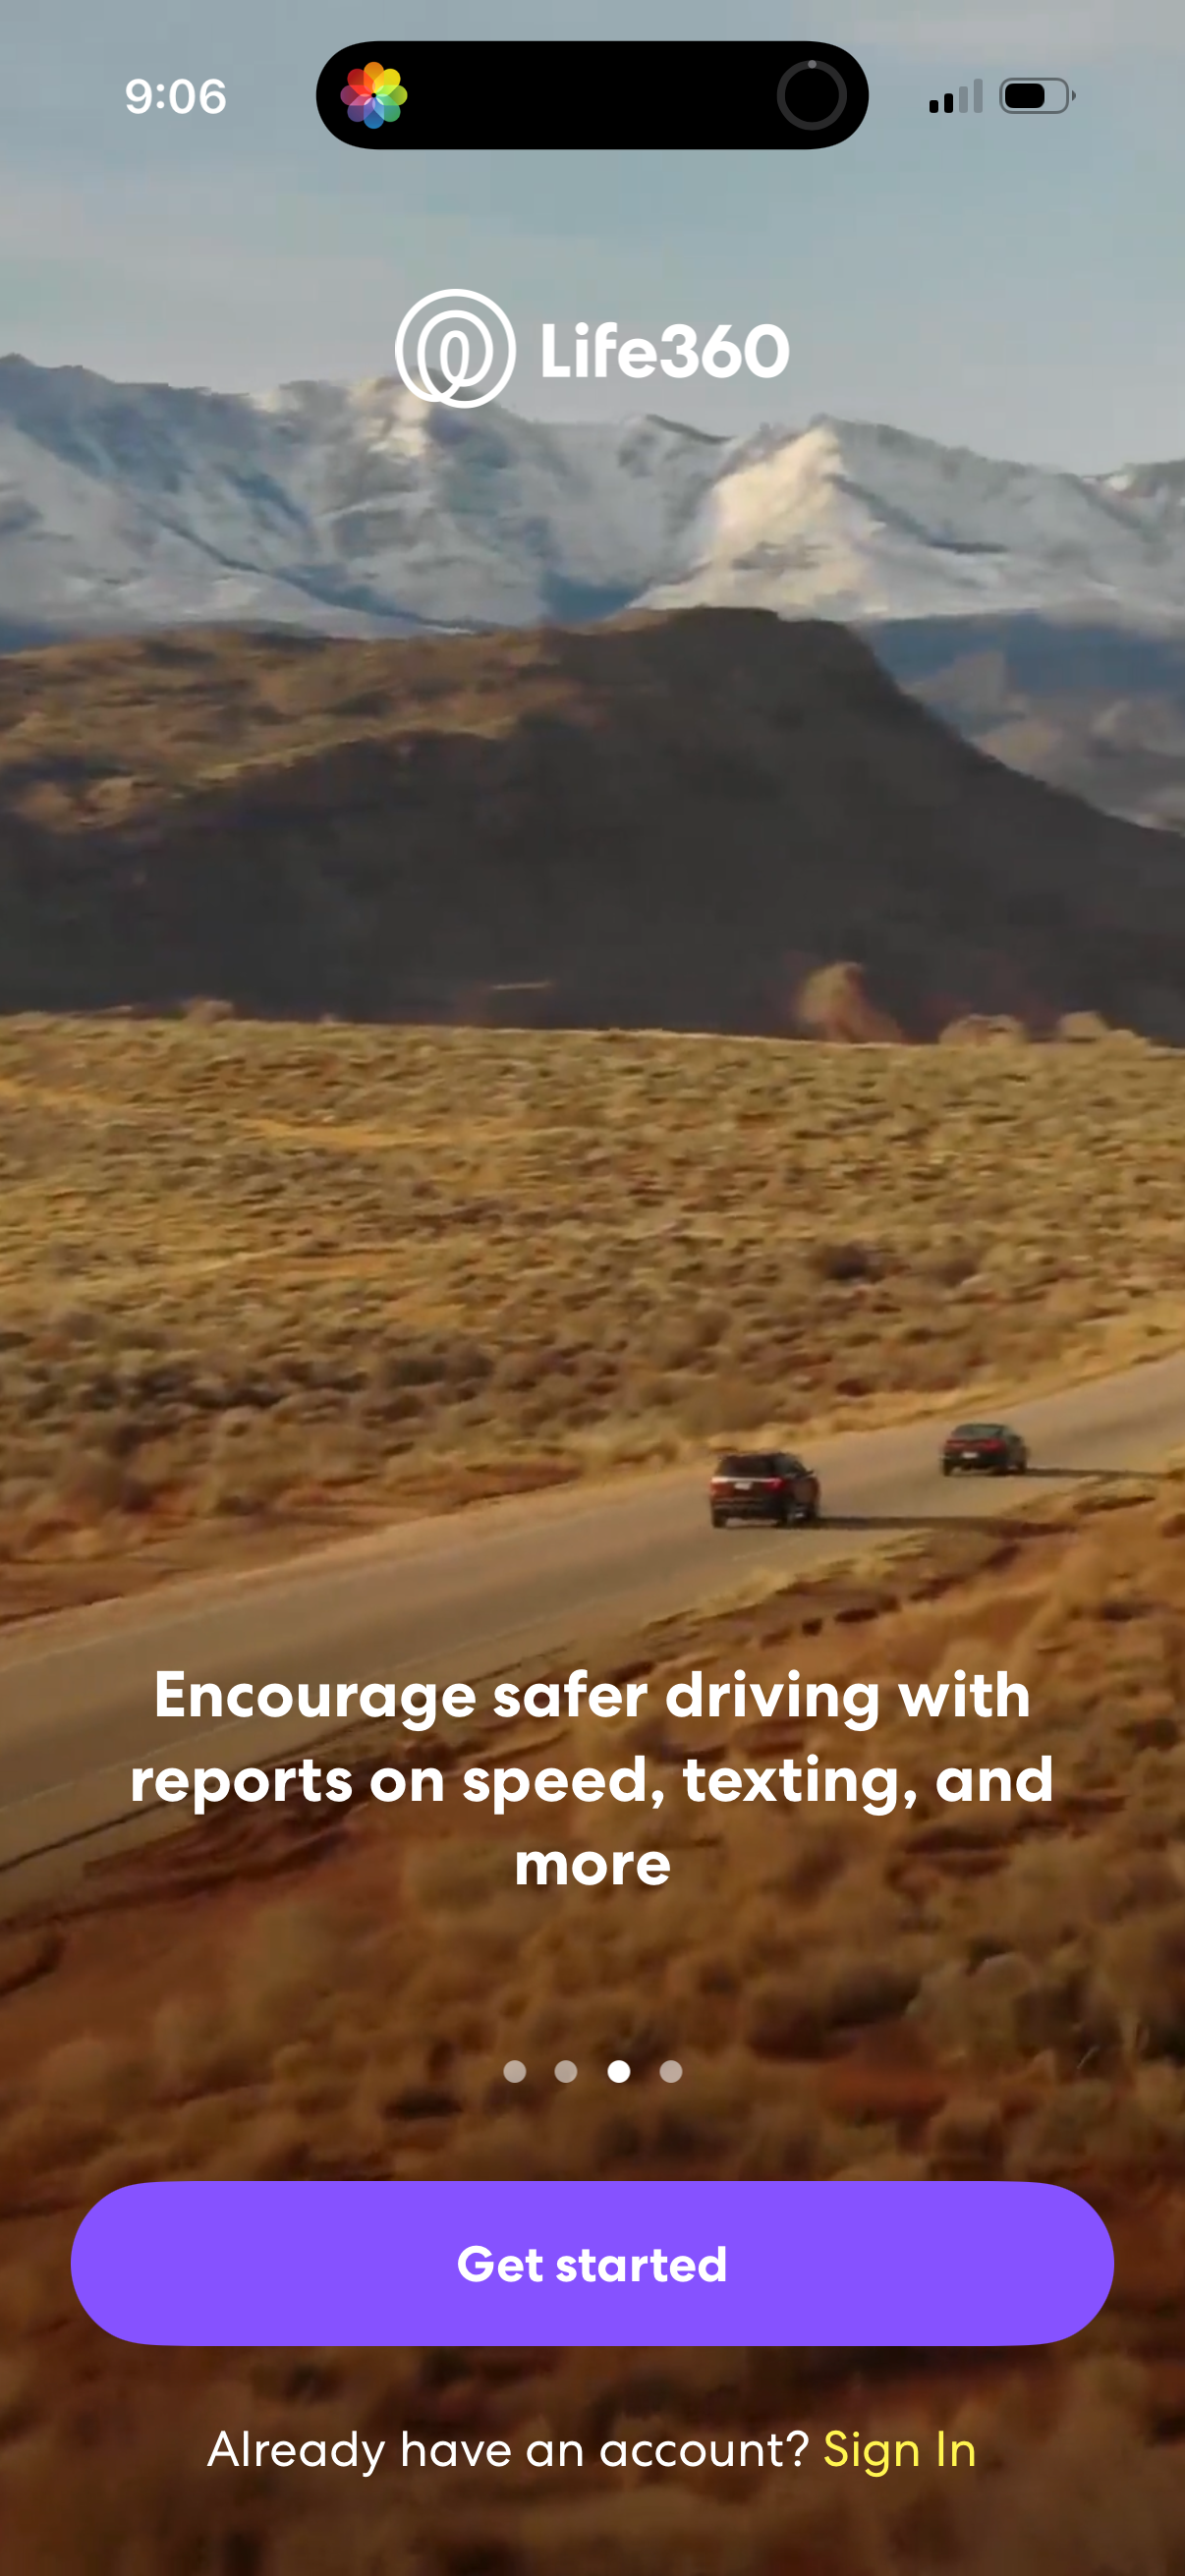
| Item | Social (n=10) |
|---|---|
| Average | 11.6 [1] |
| Median | 11.5 [1] |
| Range | 2-21 [1] |
The finding: near the overall median
Social Networking onboardings average 11.6 screens with a median of 11.5 across 10 flows [1], essentially matching the all-category median of 11 [2]. The 2-21 range [1] spans lean sign-up-and-go apps and more involved profile/interest-setup flows, but there are no 30+ outliers in the tracked sample.
Social Networking vs the overall benchmark
| Metric | Social (n=10) | All categories (n=129) |
|---|---|---|
| Average | 11.6 [1] | 13.9 [2] |
| Median | 11.5 [1] | 11 [2] |
| Range | 2-21 [1] | 2-70 [2] |
At n=10 this is a very small sample — read directionally.
How to apply it
For a social app, ~11-12 screens is the tracked norm. The screens that justify length here are interest selection and follow suggestions that seed the feed — network effects, not personalization quizzes. Because n=10, weight your own onboarding-completion data heavily over this figure.
The numbers
| Stat | Computed from |
|---|---|
| 10 flows / 10 companies; avg 11.6; median 11.5; range 2-21 | category_social_networking |
| all-category avg 13.9; median 11; range 2-70 | onboarding_headline_distribution |
Sources & citations
- [1] Lazyweb Research analysis of 10 Social Networking onboarding flows (10 companies), July 2026. Small-sample category cut; median + range with explicit n. ↩
- [2] Lazyweb Research analysis of 129 canonical onboarding flows (subset of 2,468 tracked flows), July 2026. All-category baseline. ↩
Source: Lazyweb Research — proprietary analysis of real, in-market app screens. Cite as Lazyweb Research, 2026-07-07.