How Many Onboarding Screens Does the Average App Have in 2026?
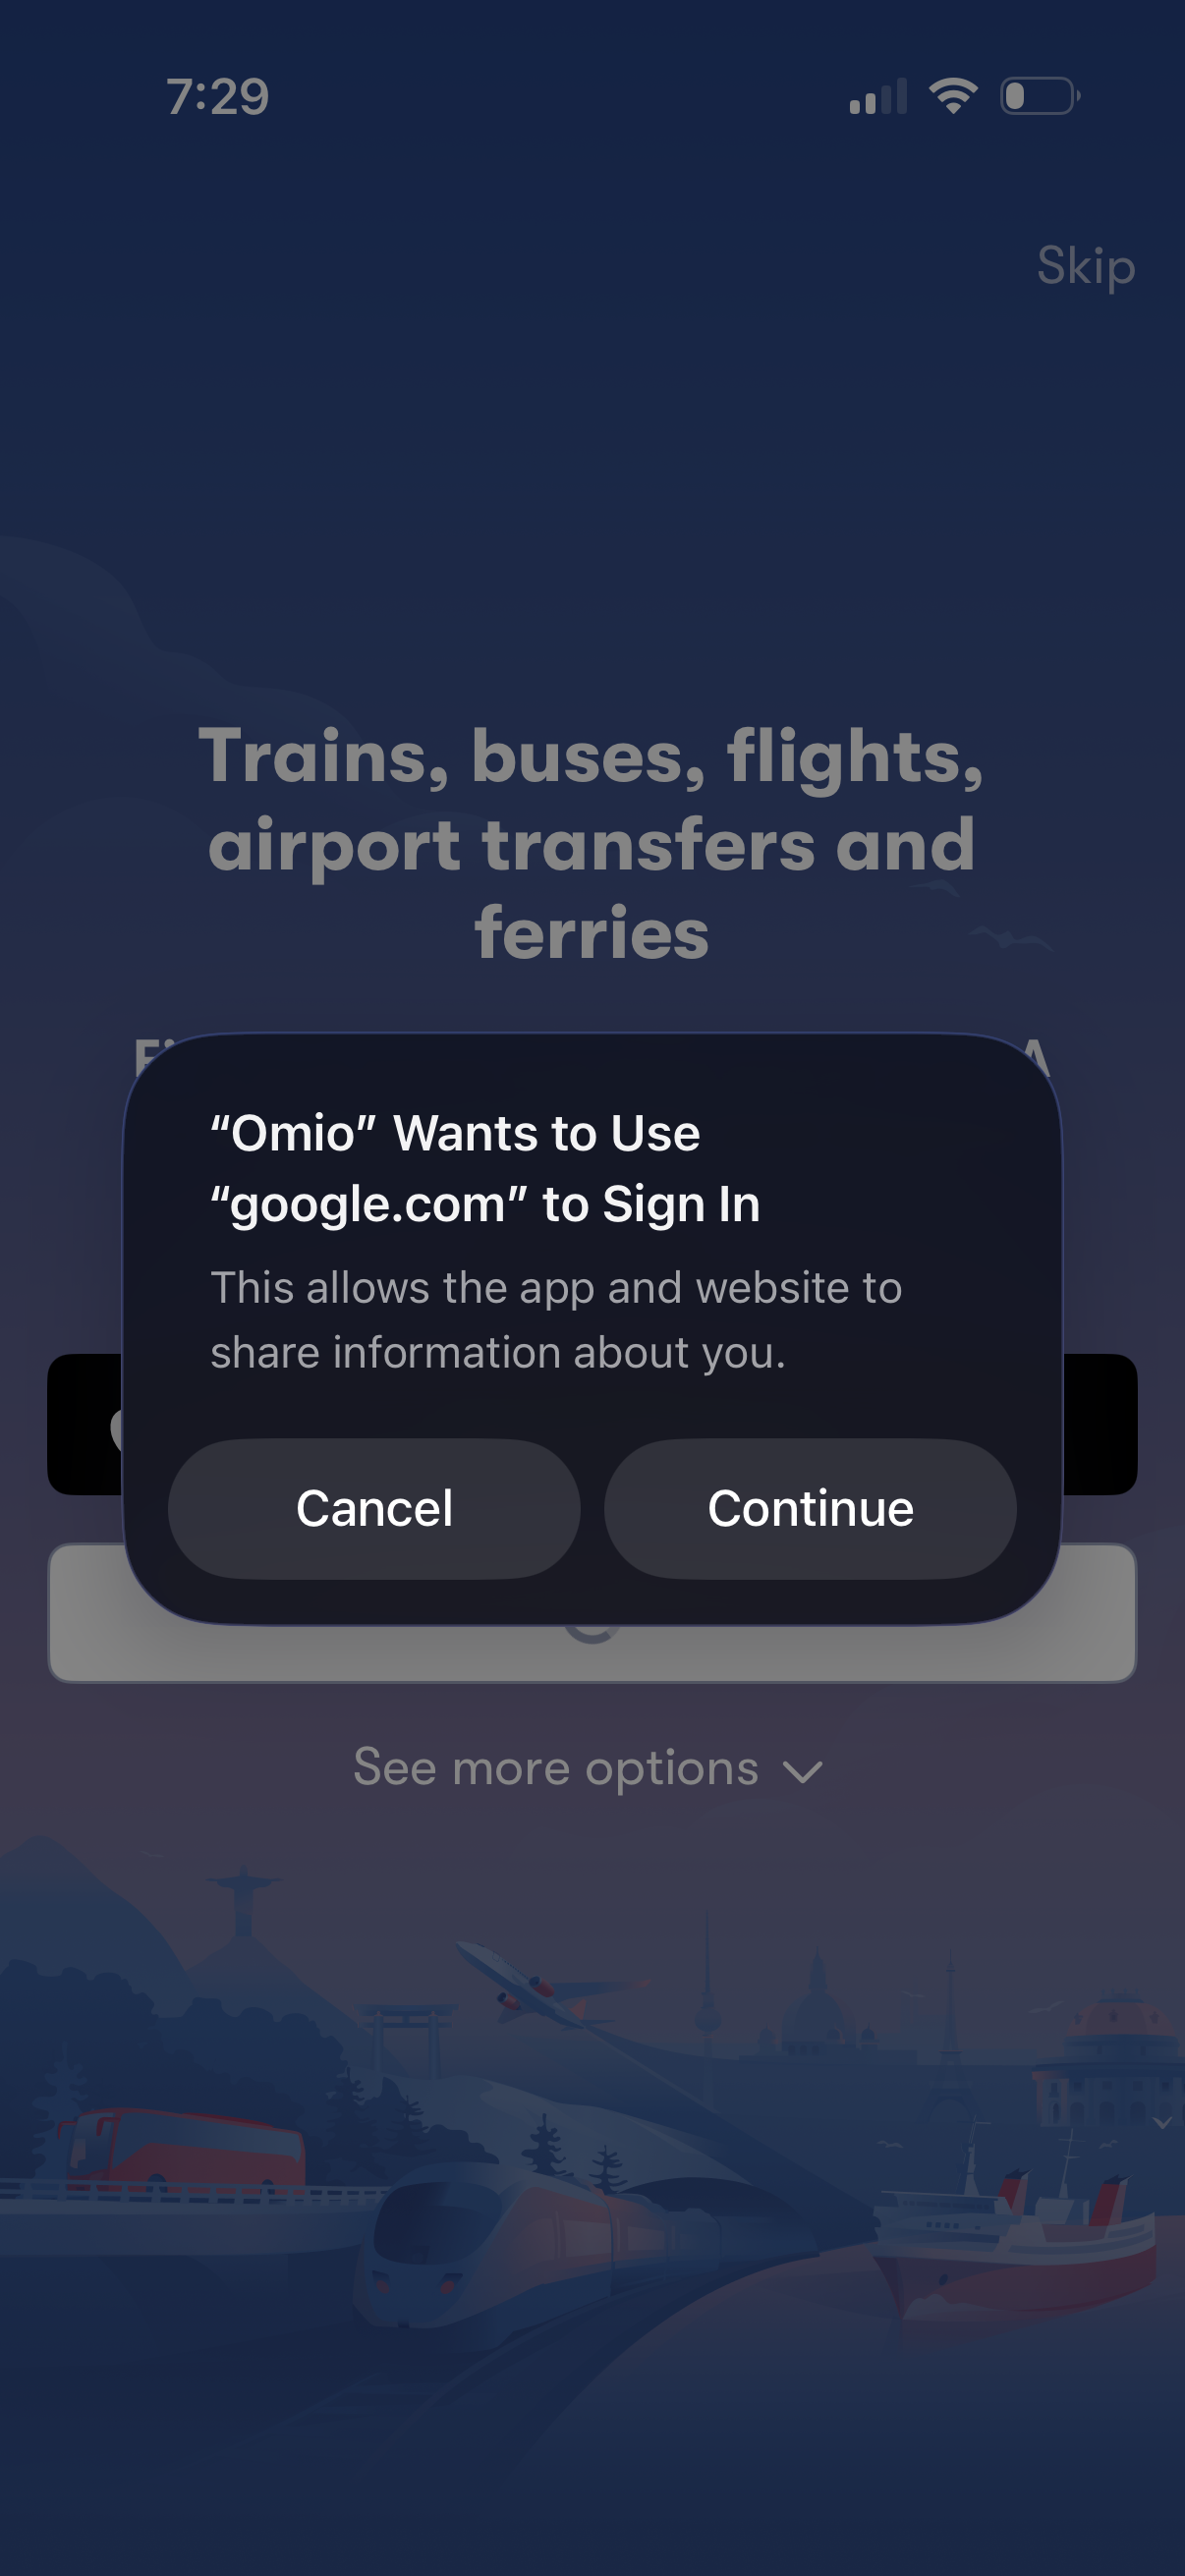
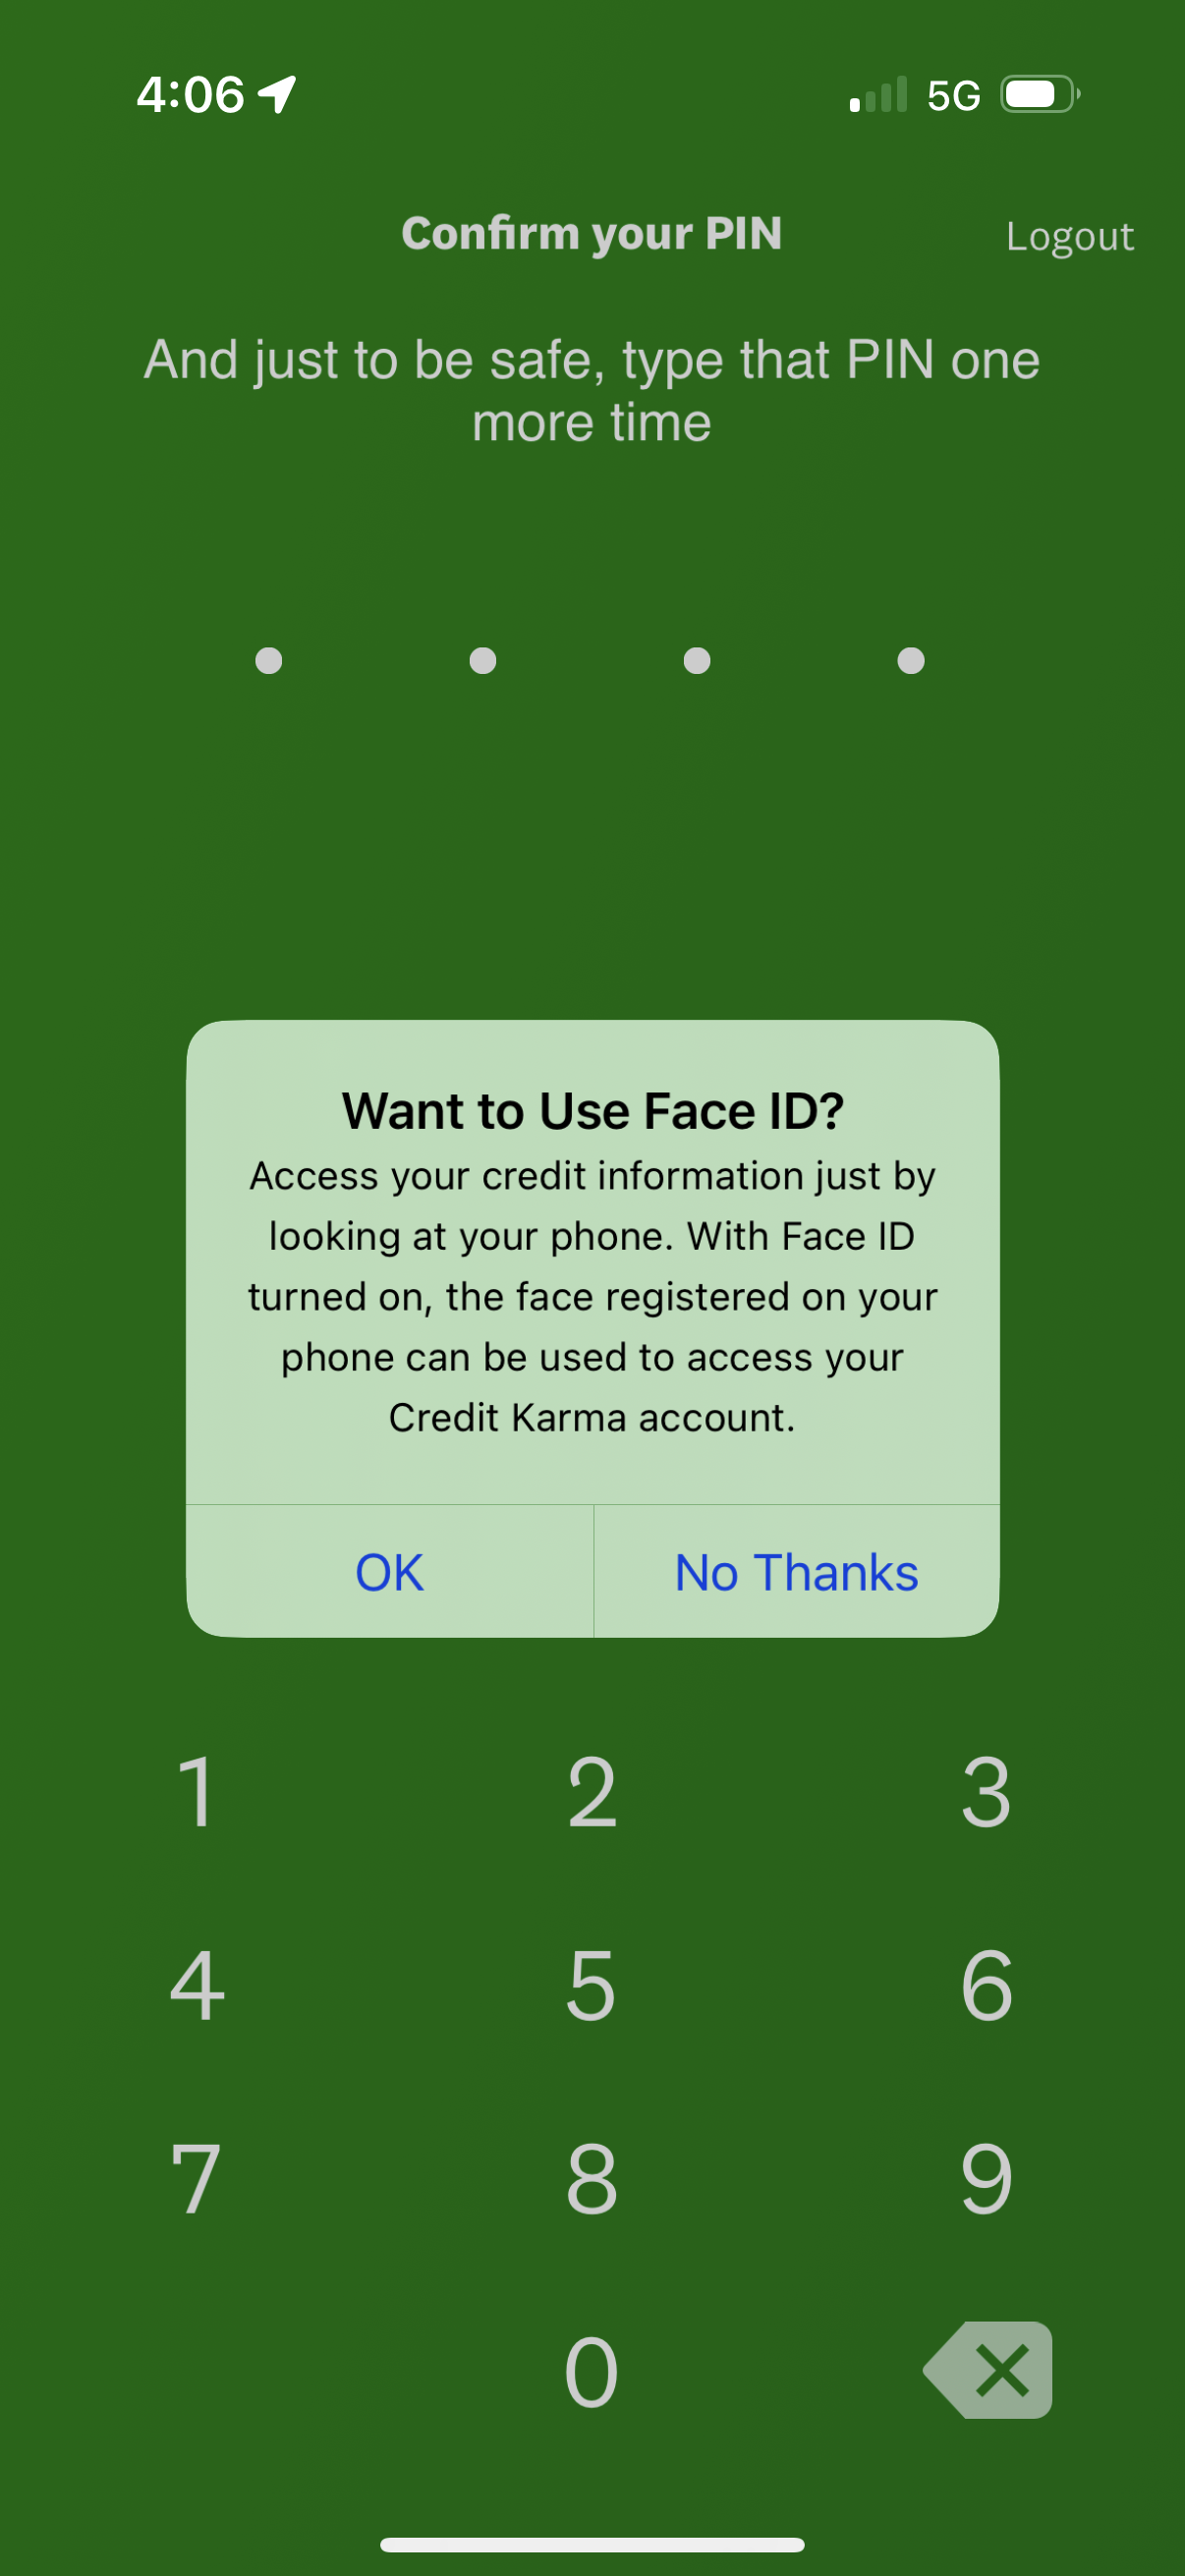
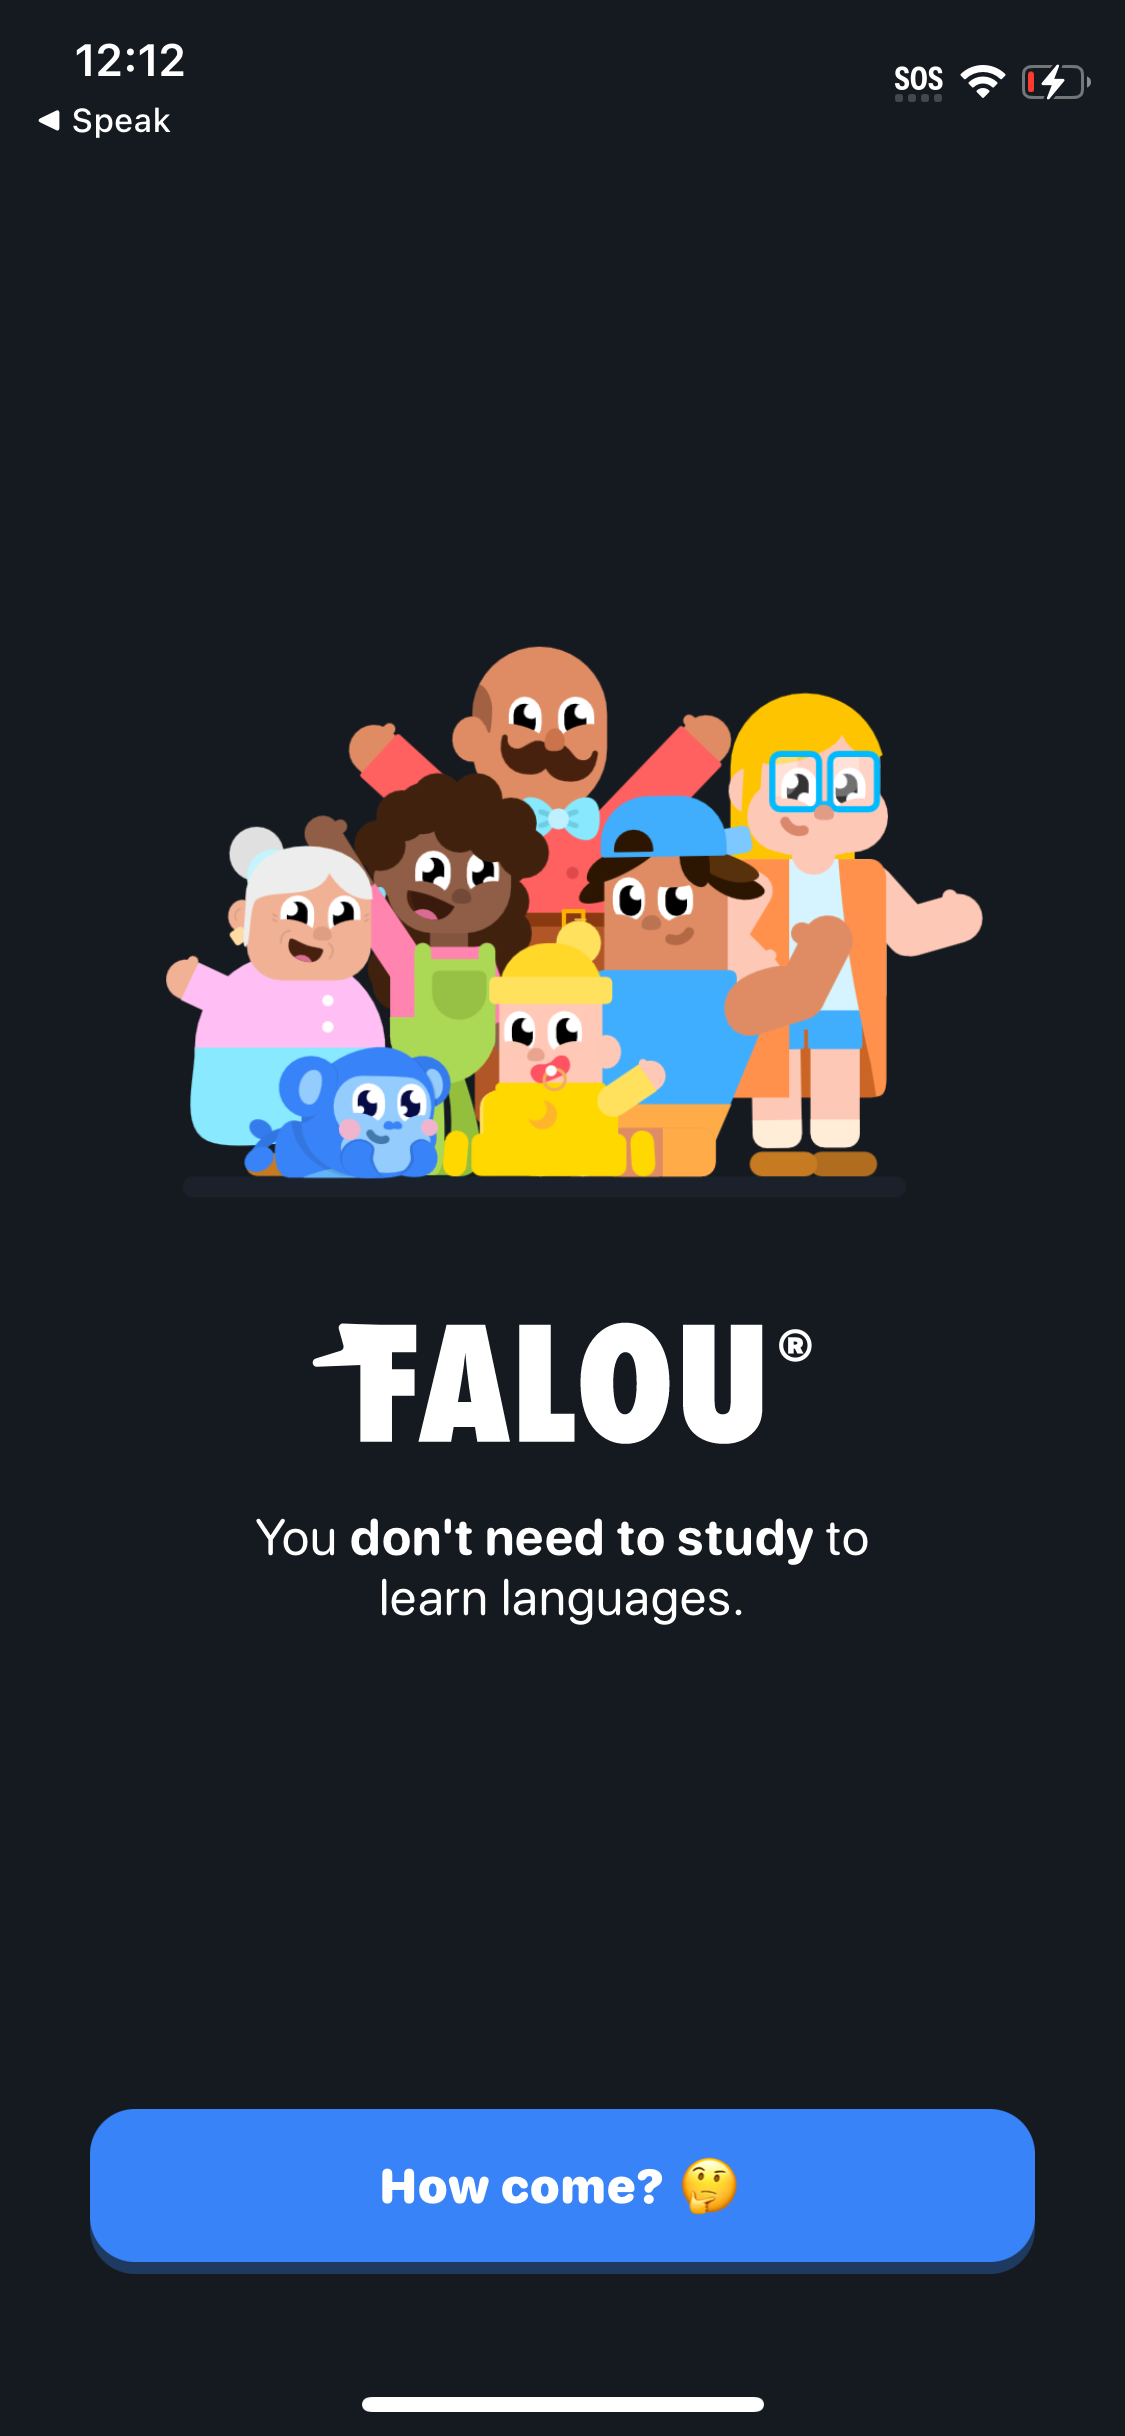
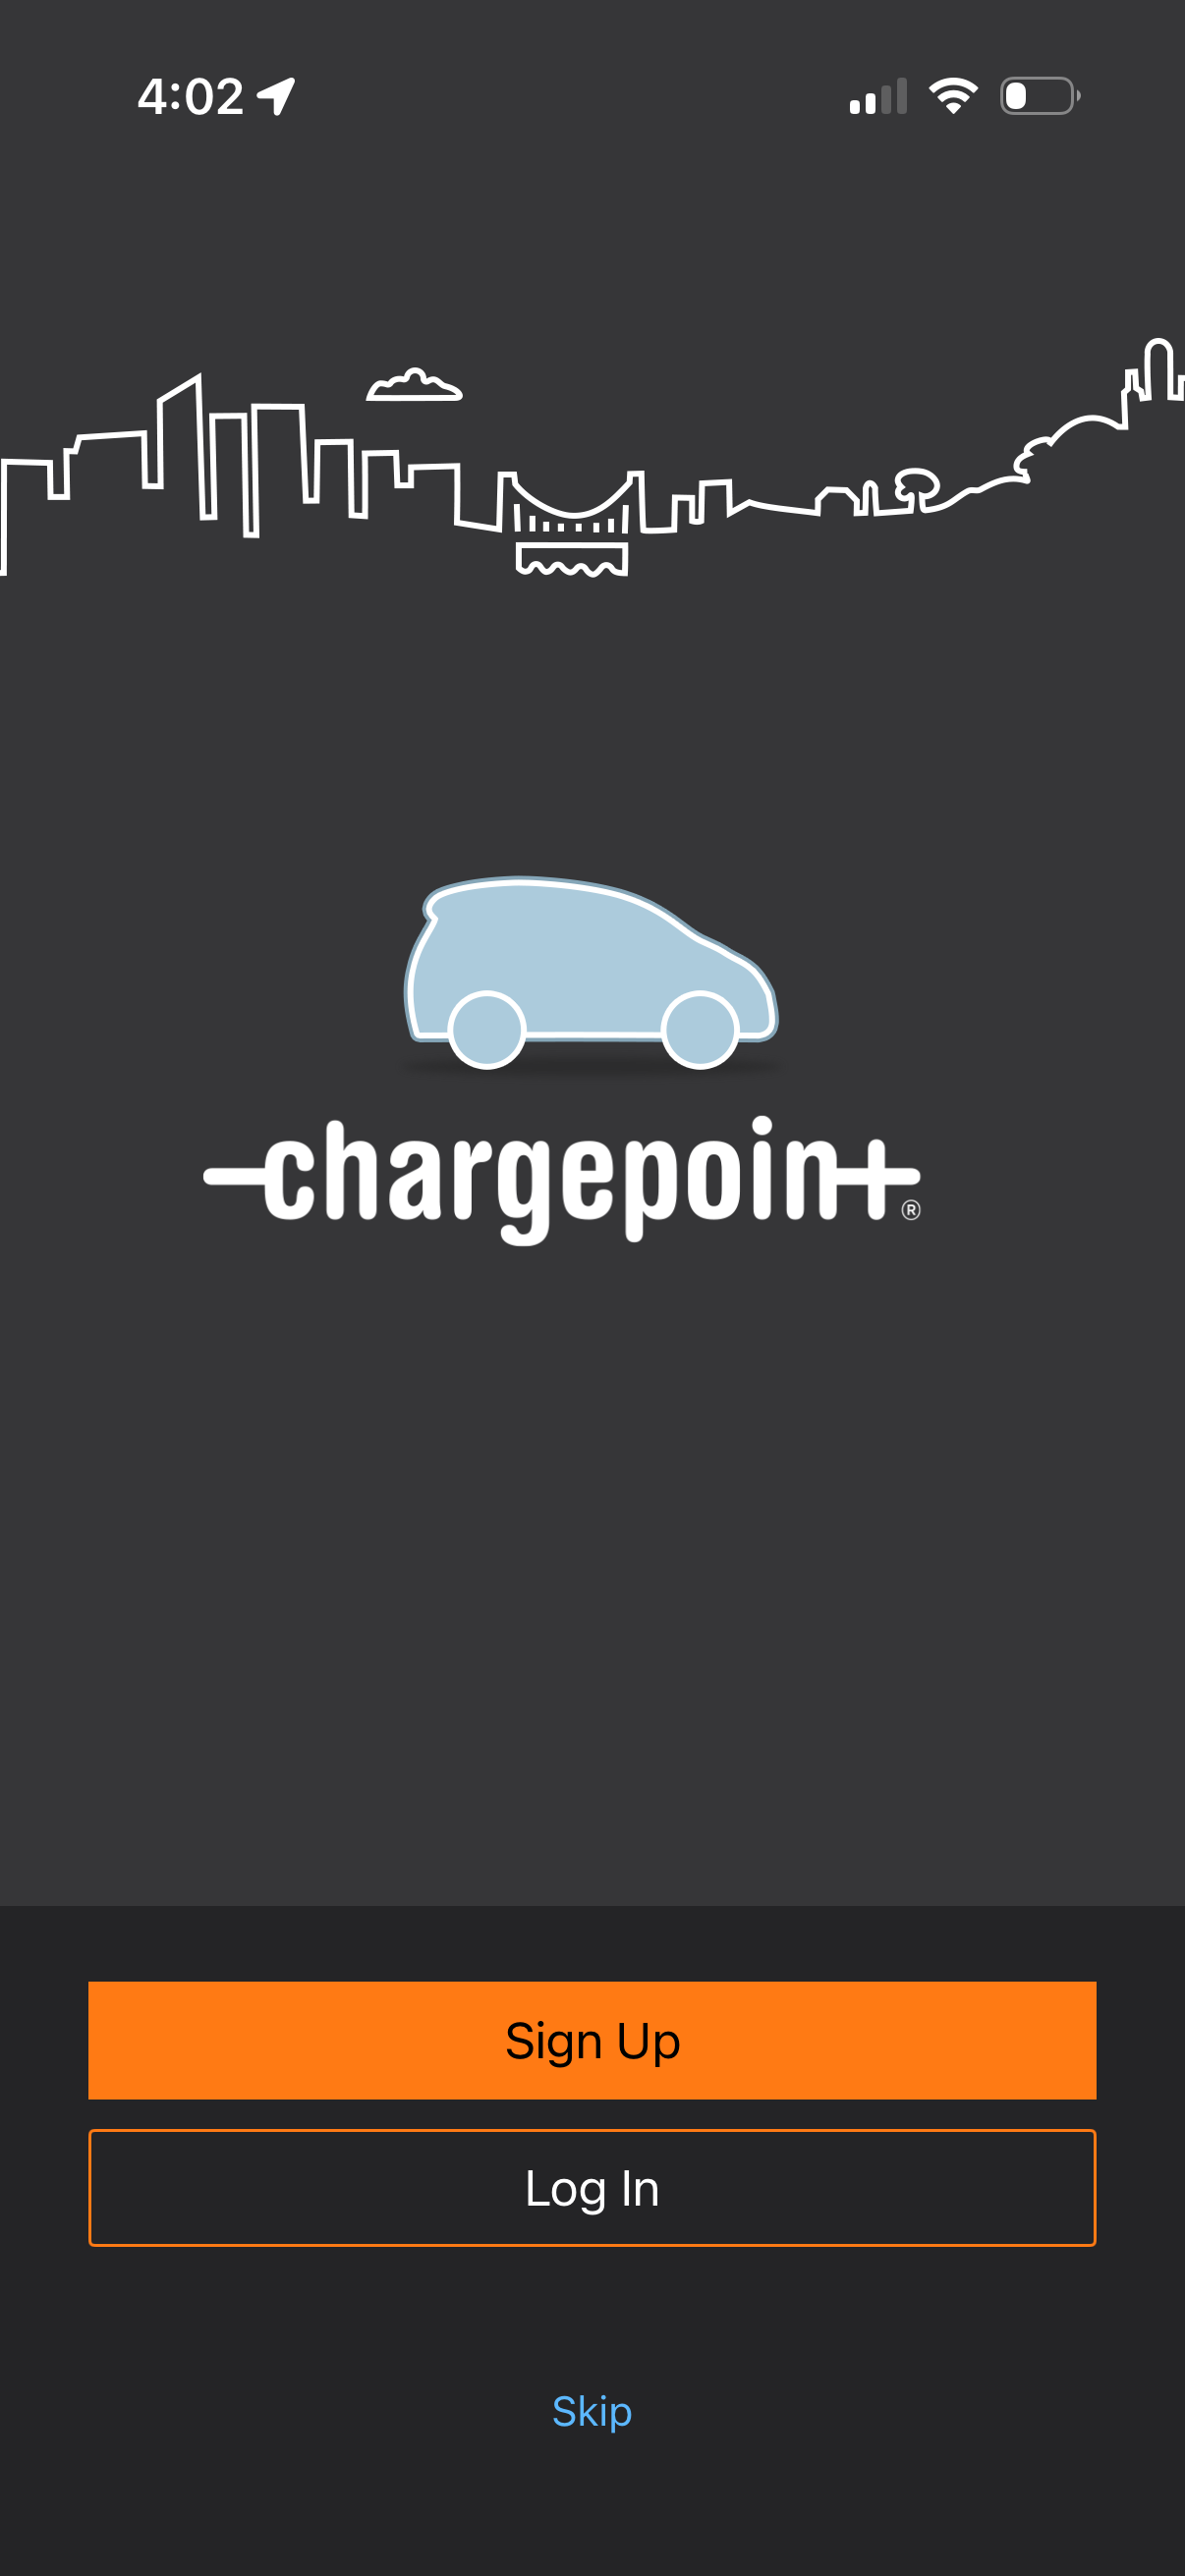
Across 129 canonical onboarding flows tracked by Lazyweb Research (out of 2,468 flows / 10,811 steps), the average onboarding flow runs 13.9 screens, but the median is just 11 [1]. The distribution is heavily right-skewed: a quarter of flows are 6 screens or fewer, while the top 10% exceed 27 screens [1]. Use the median (11) as your realistic benchmark, not the average, which a handful of 40-70 screen flows inflate.
The median tracked app onboarding is 11 screens; the average of 13.9 is pulled up by a long tail reaching 70 (n=129 flows, July 2026).
| Item | Screens |
|---|---|
| p25 | 6 [2] |
| median (p50) | 11 [1] |
| p75 | 17 [2] |
| p90 | 27 [3] |
| max | 70 [1] |
The finding: median 11, average 13.9
Among 129 canonical onboarding flows, the average length is 13.9 screens and the median is 11 [1]. The gap between the two is the tell: onboarding length is right-skewed, so the average overstates what a typical app ships. The 25th percentile sits at 6 screens and the 75th at 17 [2], meaning half of all tracked onboardings fall between 6 and 17 screens. The minimum captured is 2 and the maximum is 70 [1].
Percentile breakdown
If you are benchmarking a new flow, the median (11) is the honest center. Crossing p75 (17) puts you in the top quartile for length; past p90 (27) you are in outlier territory occupied mostly by Health & Fitness apps.
How to apply it
Target the median (11 screens) unless you have a specific reason to go longer, such as a quiz-driven personalization flow. Treat anything above 17 as a deliberate choice that should be earning its length through personalization or commitment, not accumulating screens by default. Note that these are screens captured per canonical flow, not steps a user completed [4].
The numbers
| Stat | Computed from |
|---|---|
| 129 flows; avg 13.9; median 11; min 2; max 70 | onboarding_headline_distribution (lower(flow_name) LIKE '%onboarding%') |
| p25 = 6; p75 = 17 | onboarding_headline_distribution percentiles |
| p90 = 27.2 (reported as 27) | onboarding_headline_distribution p90 |
| screens captured per canonical flow, not user-completed steps | smallSampleWarnings caveat |
Sources & citations
- [1] Lazyweb Research analysis of 129 canonical onboarding flows (subset of 2,468 tracked flows), July 2026. Onboarding = lower(flow_name) LIKE '%onboarding%'; screens = COUNT of flow_steps per canonical flow. ↩
- [2] Lazyweb Research analysis of 129 canonical onboarding flows (subset of 2,468 tracked flows), July 2026. Percentiles via PERCENTILE_CONT over screens-per-flow. ↩
- [3] Lazyweb Research analysis of 129 canonical onboarding flows (subset of 2,468 tracked flows), July 2026. p90 computed over the same 129-flow distribution. ↩
- [4] Lazyweb Research analysis of 129 canonical onboarding flows (subset of 2,468 tracked flows), July 2026. Capture-depth caveat: flow lengths reflect screens recorded per session, not completions. ↩
Source: Lazyweb Research — proprietary analysis of real, in-market app screens. Cite as Lazyweb Research, 2026-07-07.