Is 20 Onboarding Steps Too Many?
For most apps, yes. Across 129 tracked onboarding flows, only 20% run 20 screens or more [1], so a 20-step flow is longer than four out of five apps. It roughly doubles the median of 11 [2]. The main category where 20 is normal is Health & Fitness, whose median is 20.5 [3].
Only 20% of tracked onboardings (26 of 129) reach 20 screens — four in five apps are shorter (July 2026).

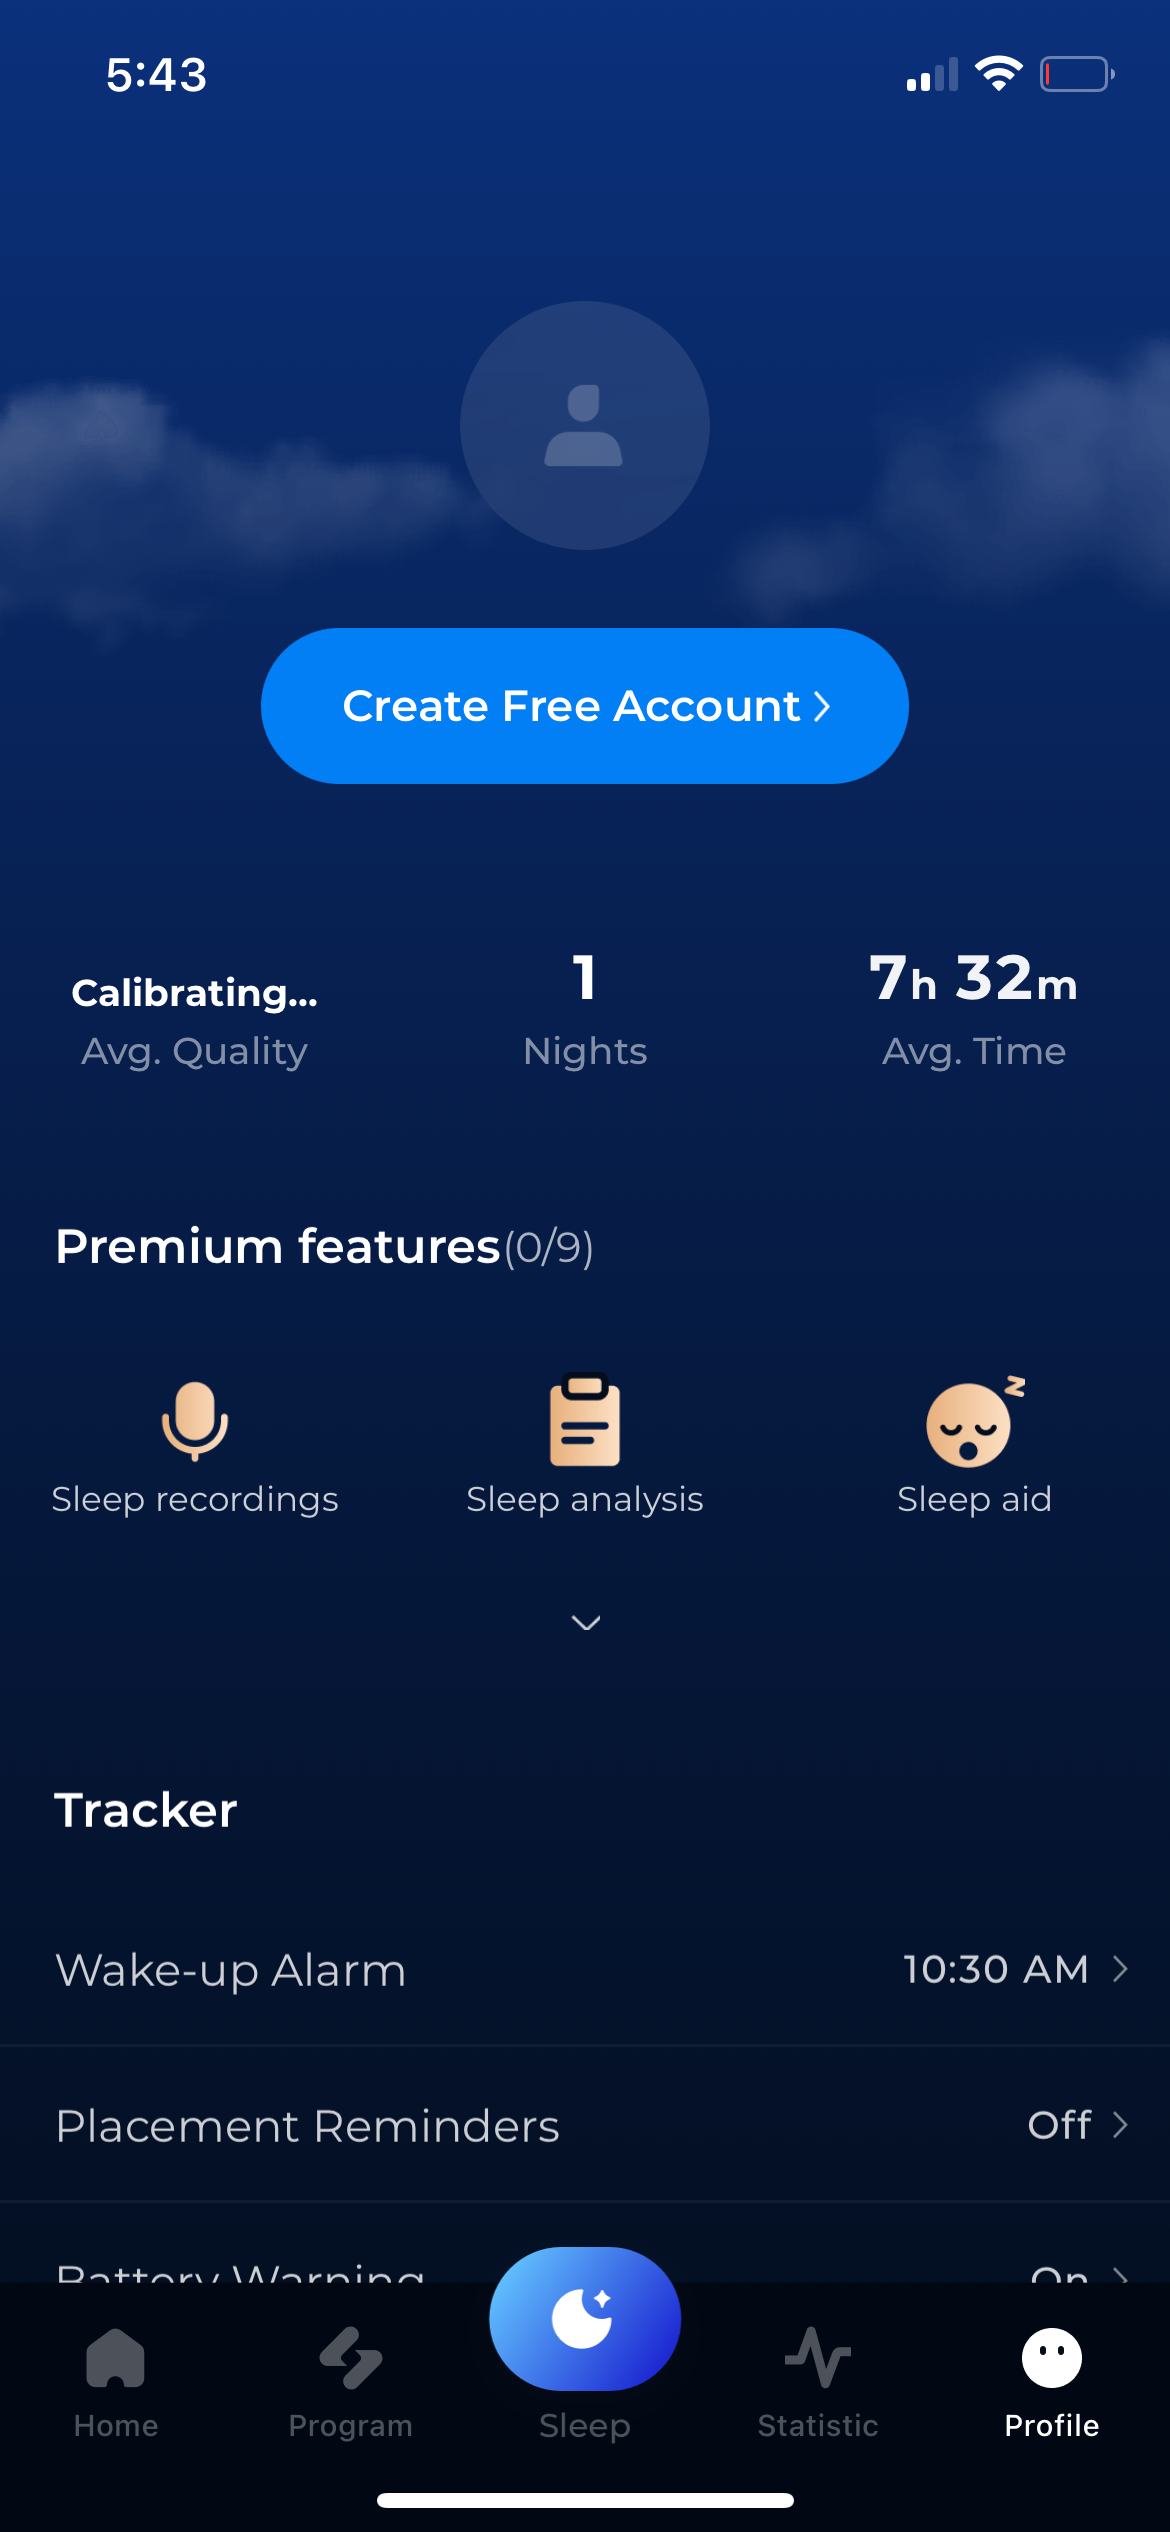
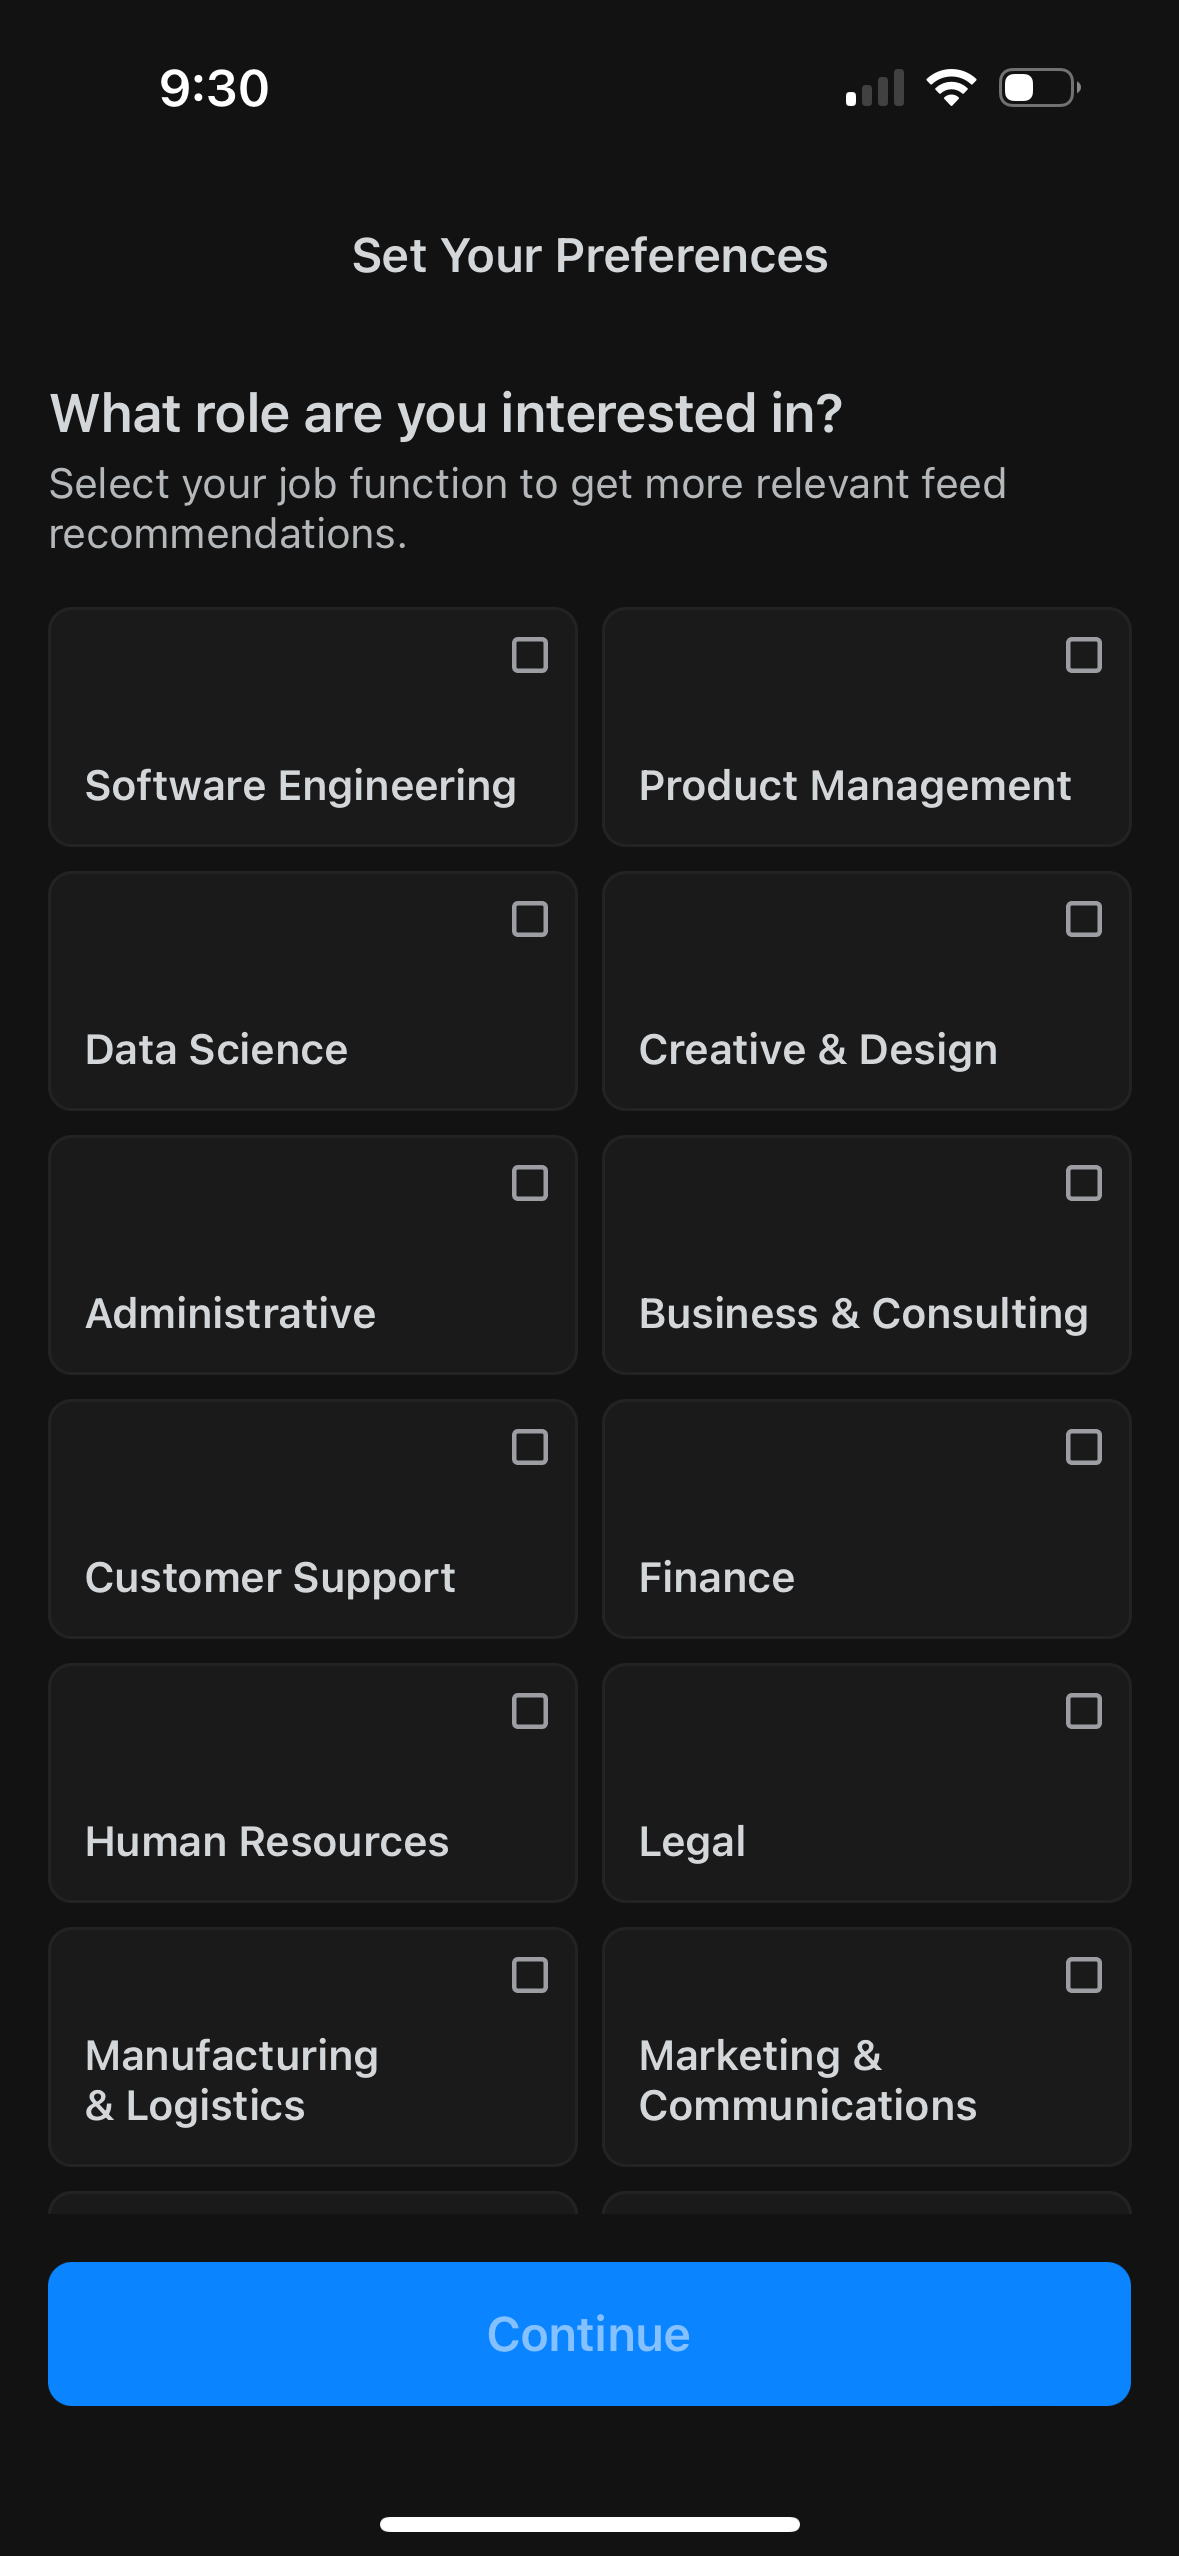
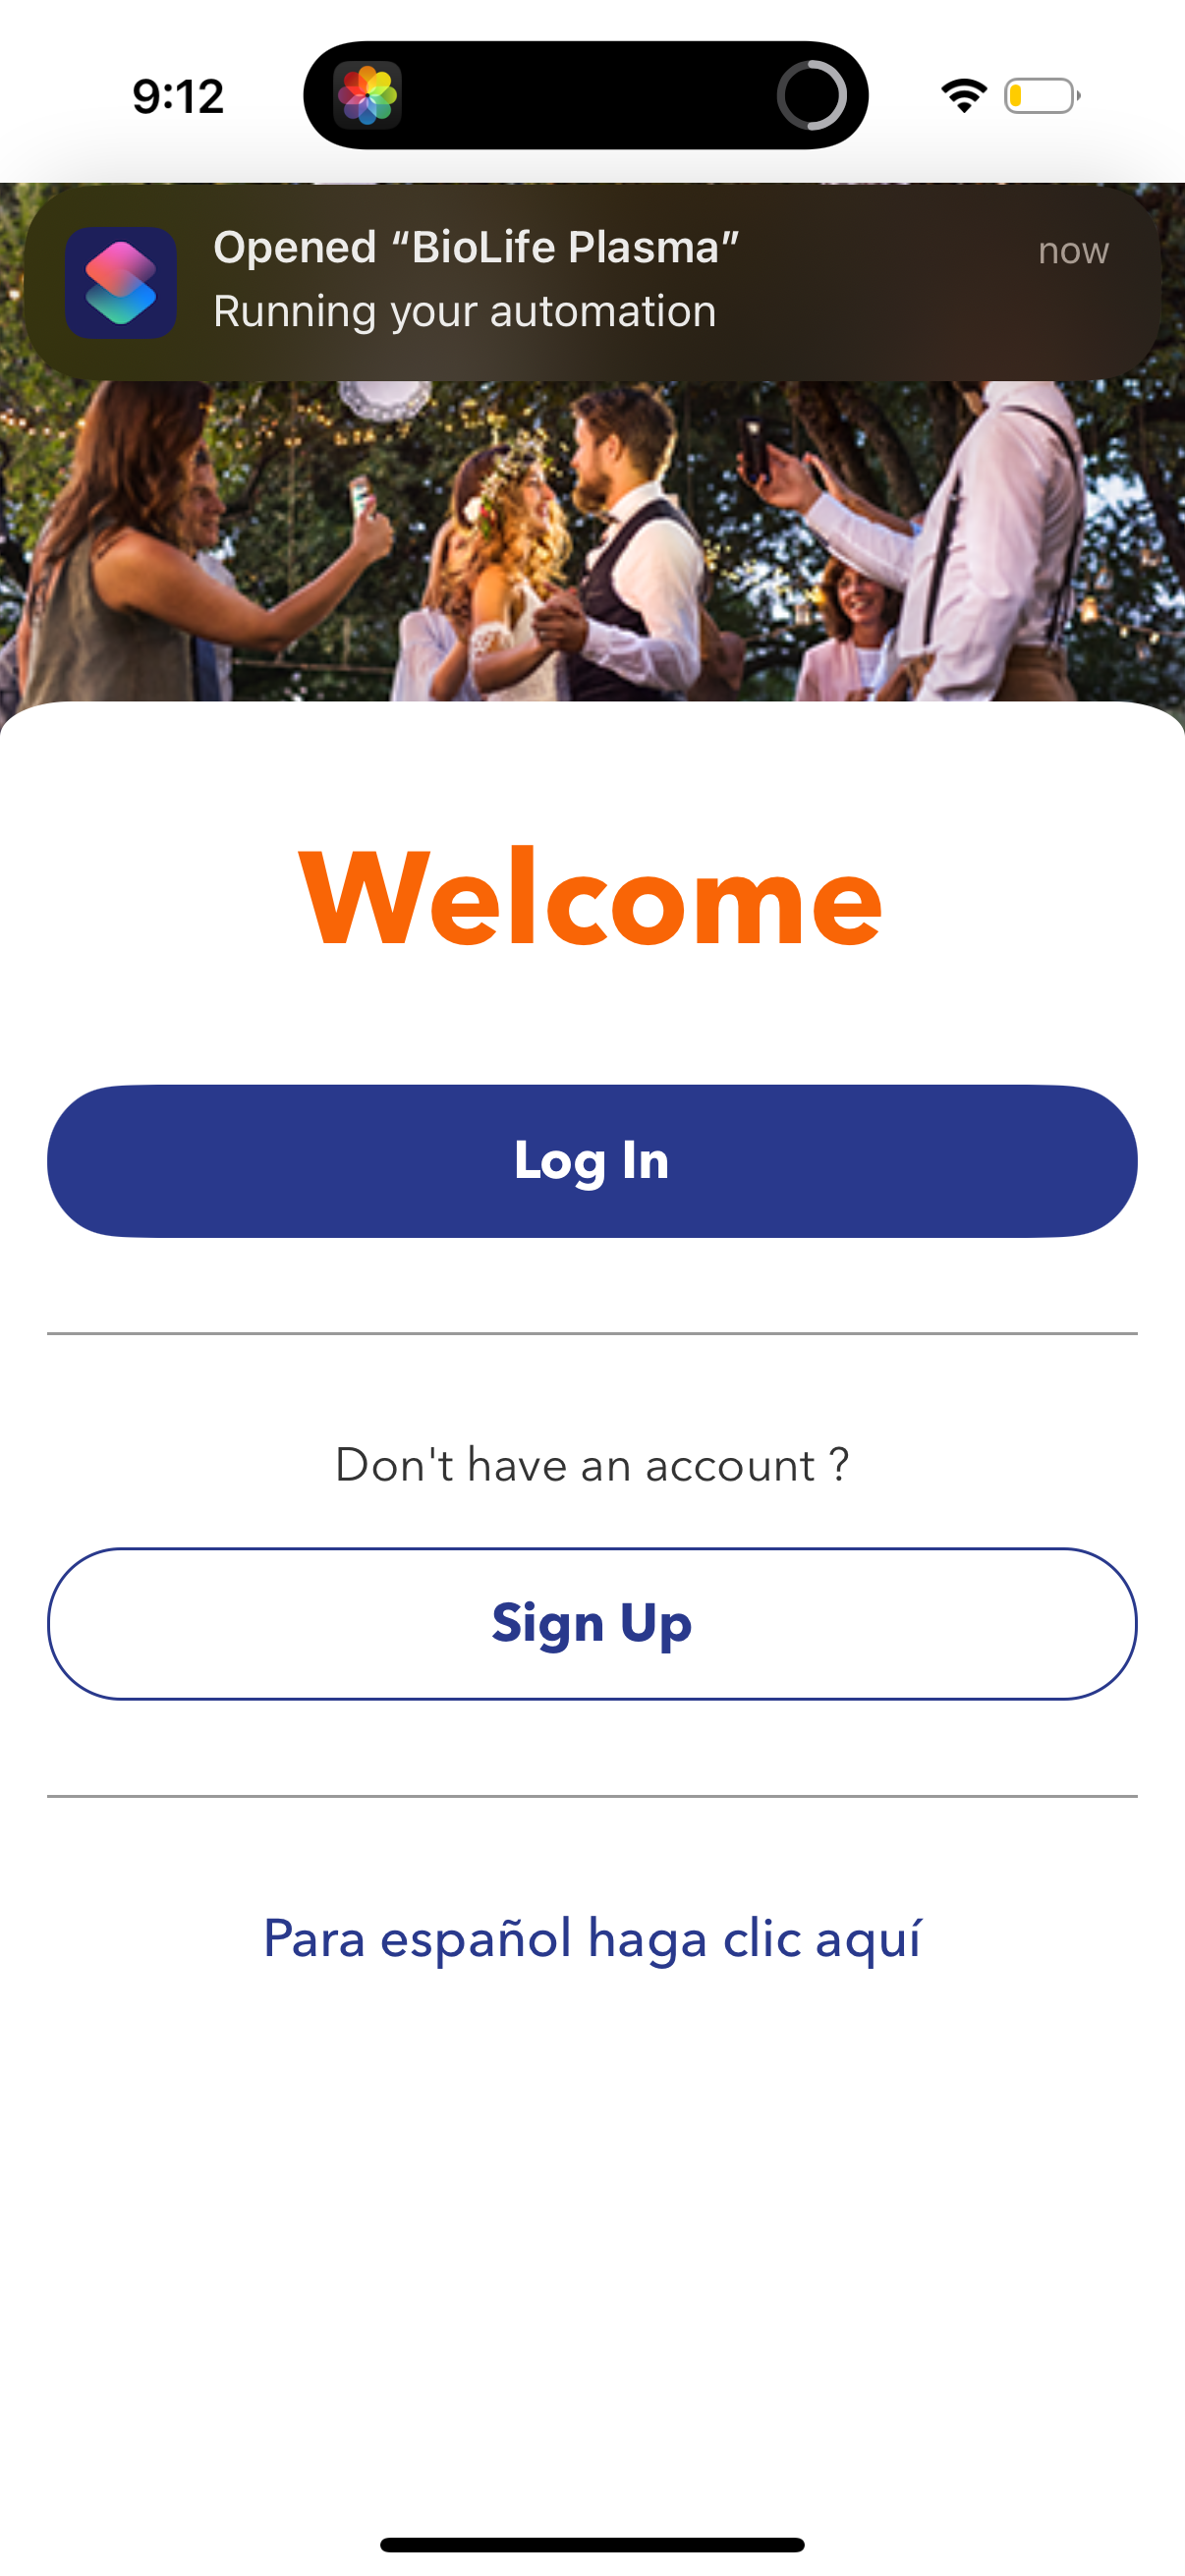
| Item | Share |
|---|---|
| >=15 screens | 32% [1] |
| >=20 | 20% [1] |
| >=25 | 13% [1] |
| >=30 | 9% [1] |
The finding: 20 screens is a top-quintile flow
26 of 129 flows are 20 screens or more [1], meaning just 20% of apps run this long. Against a median of 11 [2], a 20-step onboarding is nearly double the typical length and past the p75 of 17 [2]. For the average app, 20 steps is more than the benchmark supports.
Who runs 20+ and why
| Threshold | Flows at or above | Share |
|---|---|---|
| >=15 screens | 41 / 129 | 32% [1] |
| >=20 | 26 / 129 | 20% [1] |
| >=25 | 17 / 129 | 13% [1] |
| >=30 | 12 / 129 | 9% [1] |
Health & Fitness is the one category where 20 is typical (category median 20.5, n=26) [3]; it uses the length for quiz-driven plan personalization. Education runs long too (median 15, n=13) [4].
How to apply it
Only go to 20 screens if you're in a category where long, personalized onboarding is the norm and the length demonstrably lifts activation or conversion. If you're a productivity, social, or utility app, 20 steps puts you well outside your category norms — those verticals cluster near 9-12 screens [5].
The numbers
| Stat | Computed from |
|---|---|
| >=15: 41/129; >=20: 26/129 (20.2%); >=25: 17/129; >=30: 12/129 | is_N_too_many_thresholds |
| median 11; p75 = 17 | onboarding_headline_distribution |
| Health & Fitness median 20.5 (n=26) | category_health_fitness |
| Education median 15 (n=13) | category_education |
| Productivity median 11.5 (n=12); Photo & Video median 9 (n=12) | category_productivity, category_photo_video |
Sources & citations
- [1] Lazyweb Research analysis of 129 canonical onboarding flows (subset of 2,468 tracked flows), July 2026. Share of flows at or above each screen threshold. ↩
- [2] Lazyweb Research analysis of 129 canonical onboarding flows (subset of 2,468 tracked flows), July 2026. Median and p75 from the distribution. ↩
- [3] Lazyweb Research analysis of 26 Health & Fitness onboarding flows, July 2026. Category median; n=26 across 24 companies. ↩
- [4] Lazyweb Research analysis of 13 Education onboarding flows, July 2026. Small-sample category median; reported with explicit n. ↩
- [5] Lazyweb Research analysis of 12 Productivity and 12 Photo & Video onboarding flows, July 2026. Small-sample category medians reported with explicit n. ↩
Source: Lazyweb Research — proprietary analysis of real, in-market app screens. Cite as Lazyweb Research, 2026-07-07.