Which tracked apps have the richest checkout and payment flows?
Among the 77 tracked mobile checkout apps, iam leads with 12 captured checkout/payment screens, followed by lyft (10), uber-eats (9), amex (8), and robinhood (8) [1]. These are the best named anchors for studying multi-step payment flows. The corpus is small (169 screens across 77 apps), so use these as case studies, not a ranking of quality [2].
iam (12), lyft (10) and uber-eats (9) have the most captured checkout screens among 77 tracked apps — Lazyweb Research, July 2026.
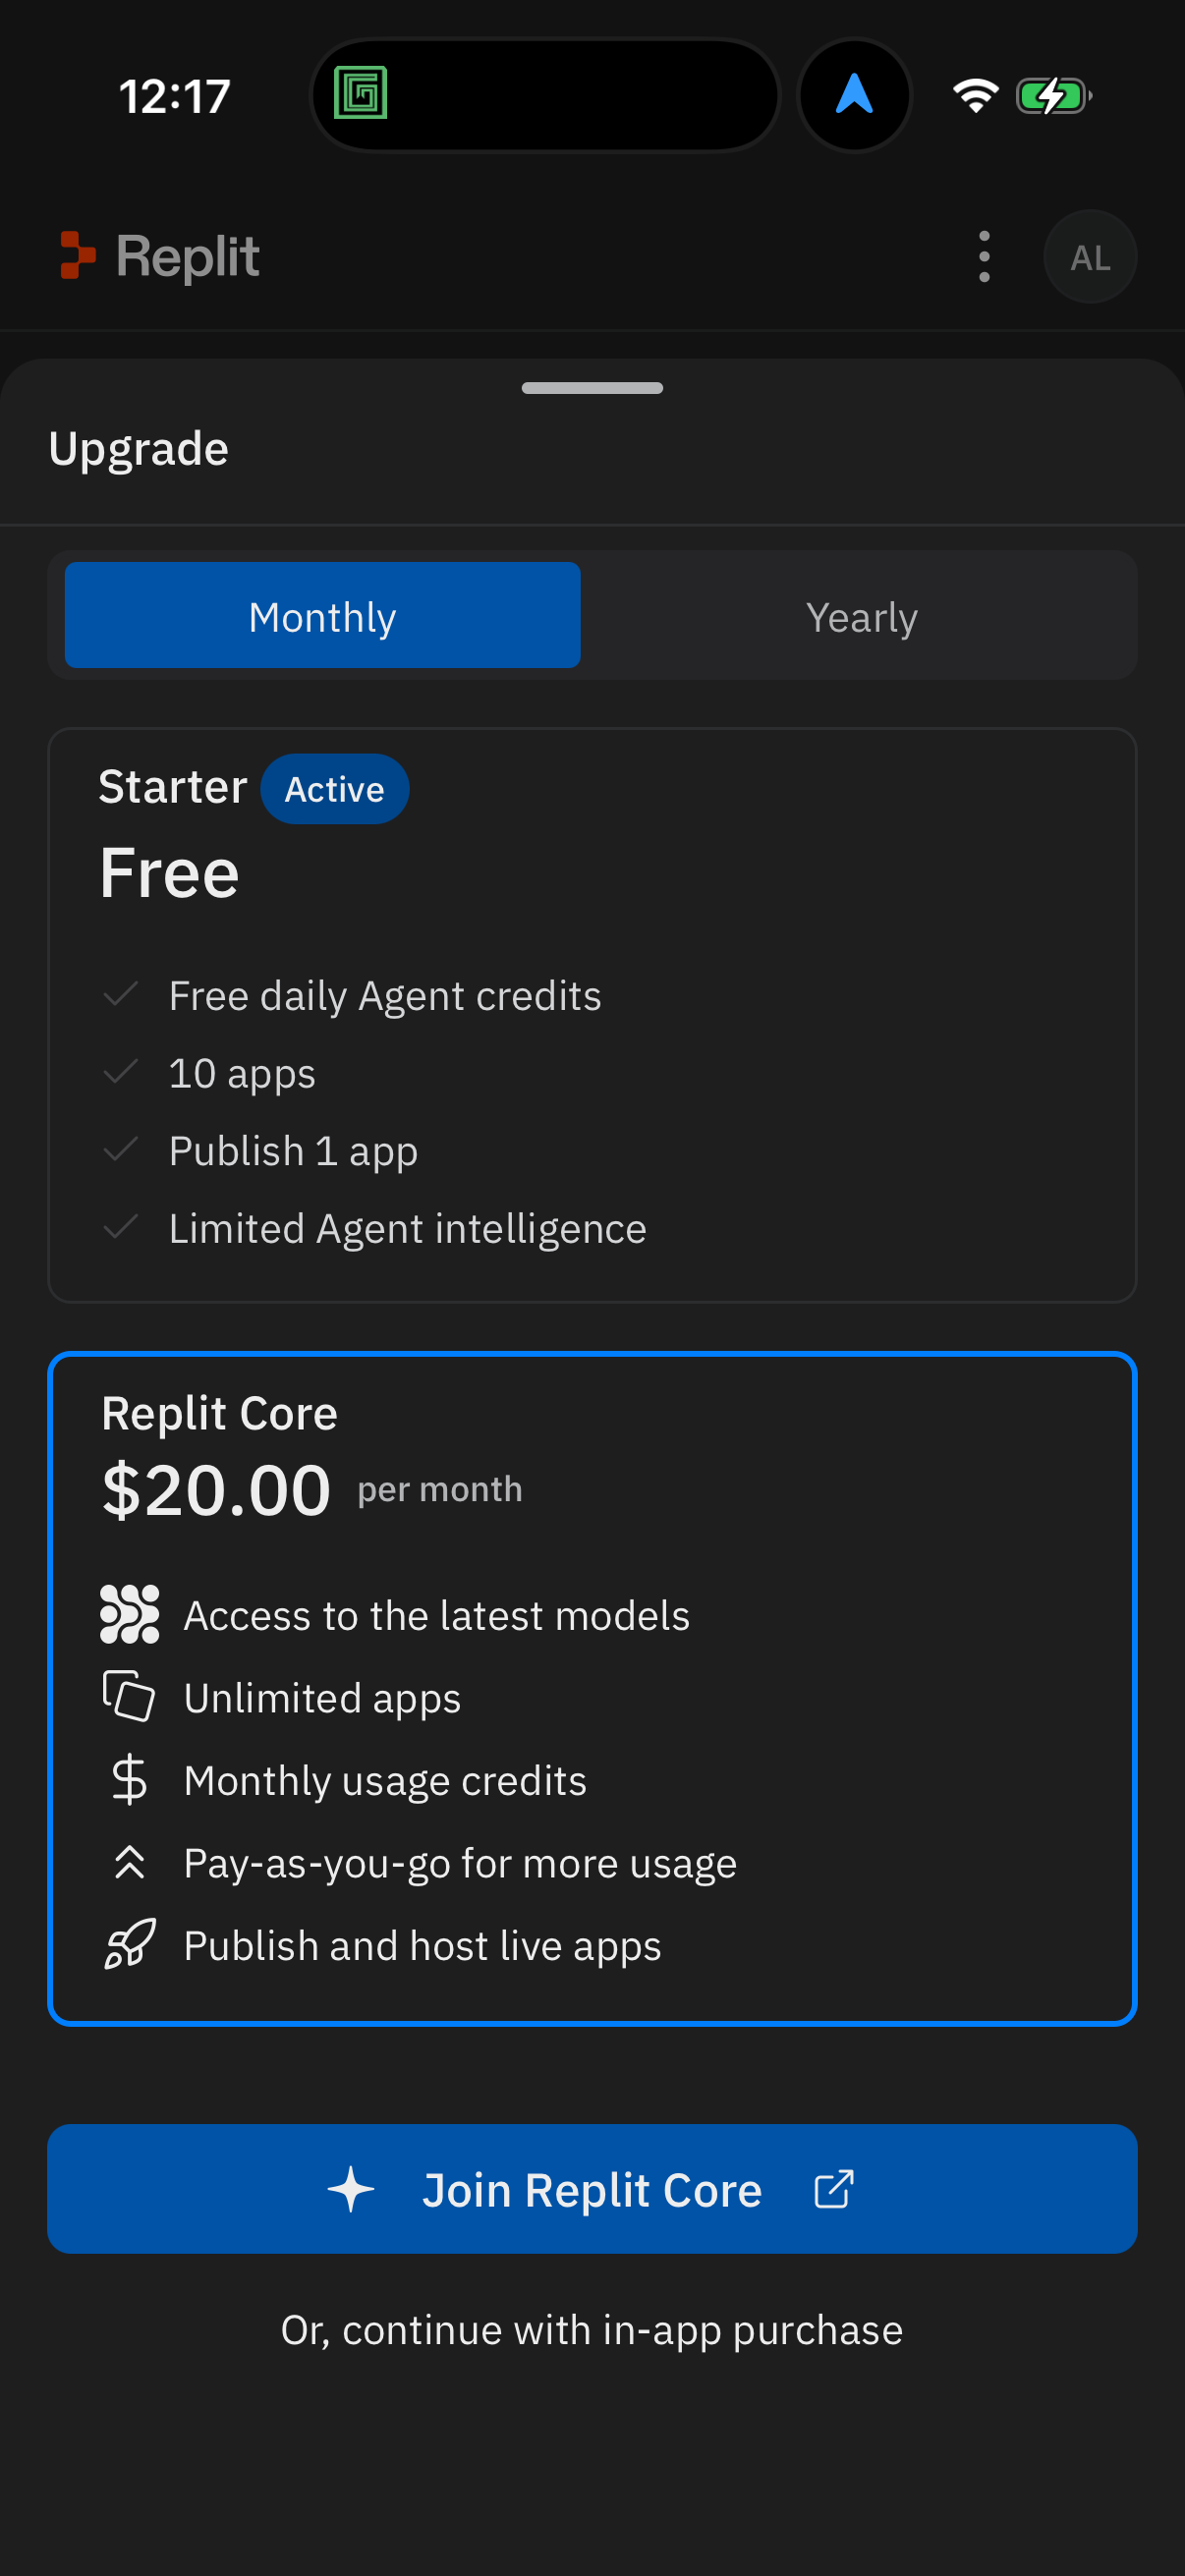
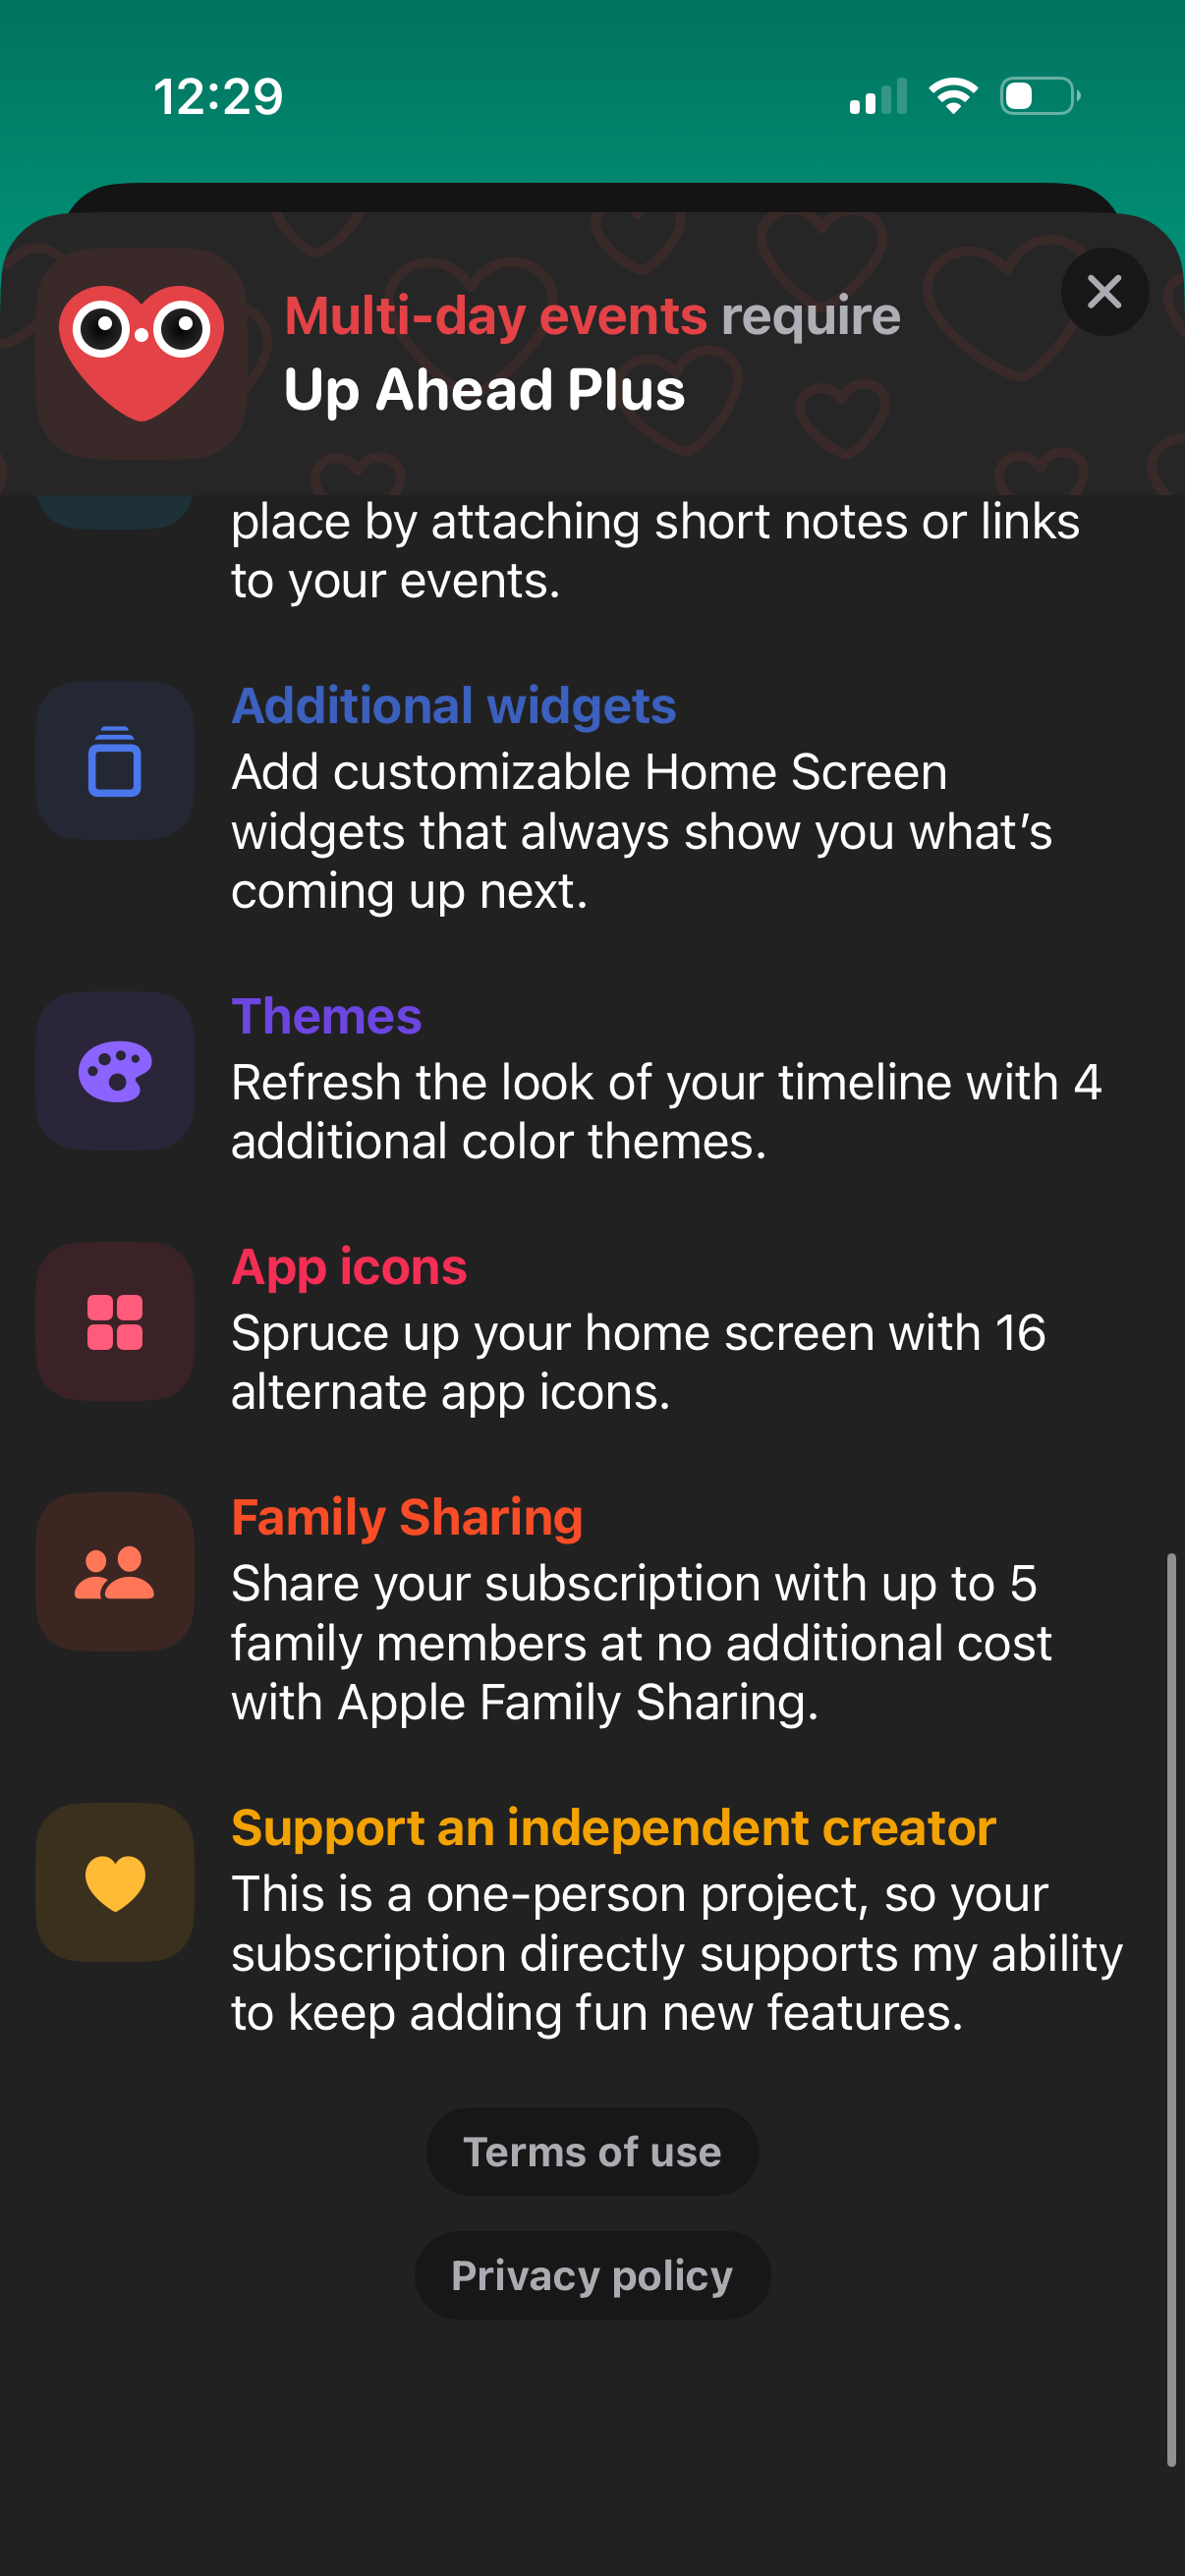
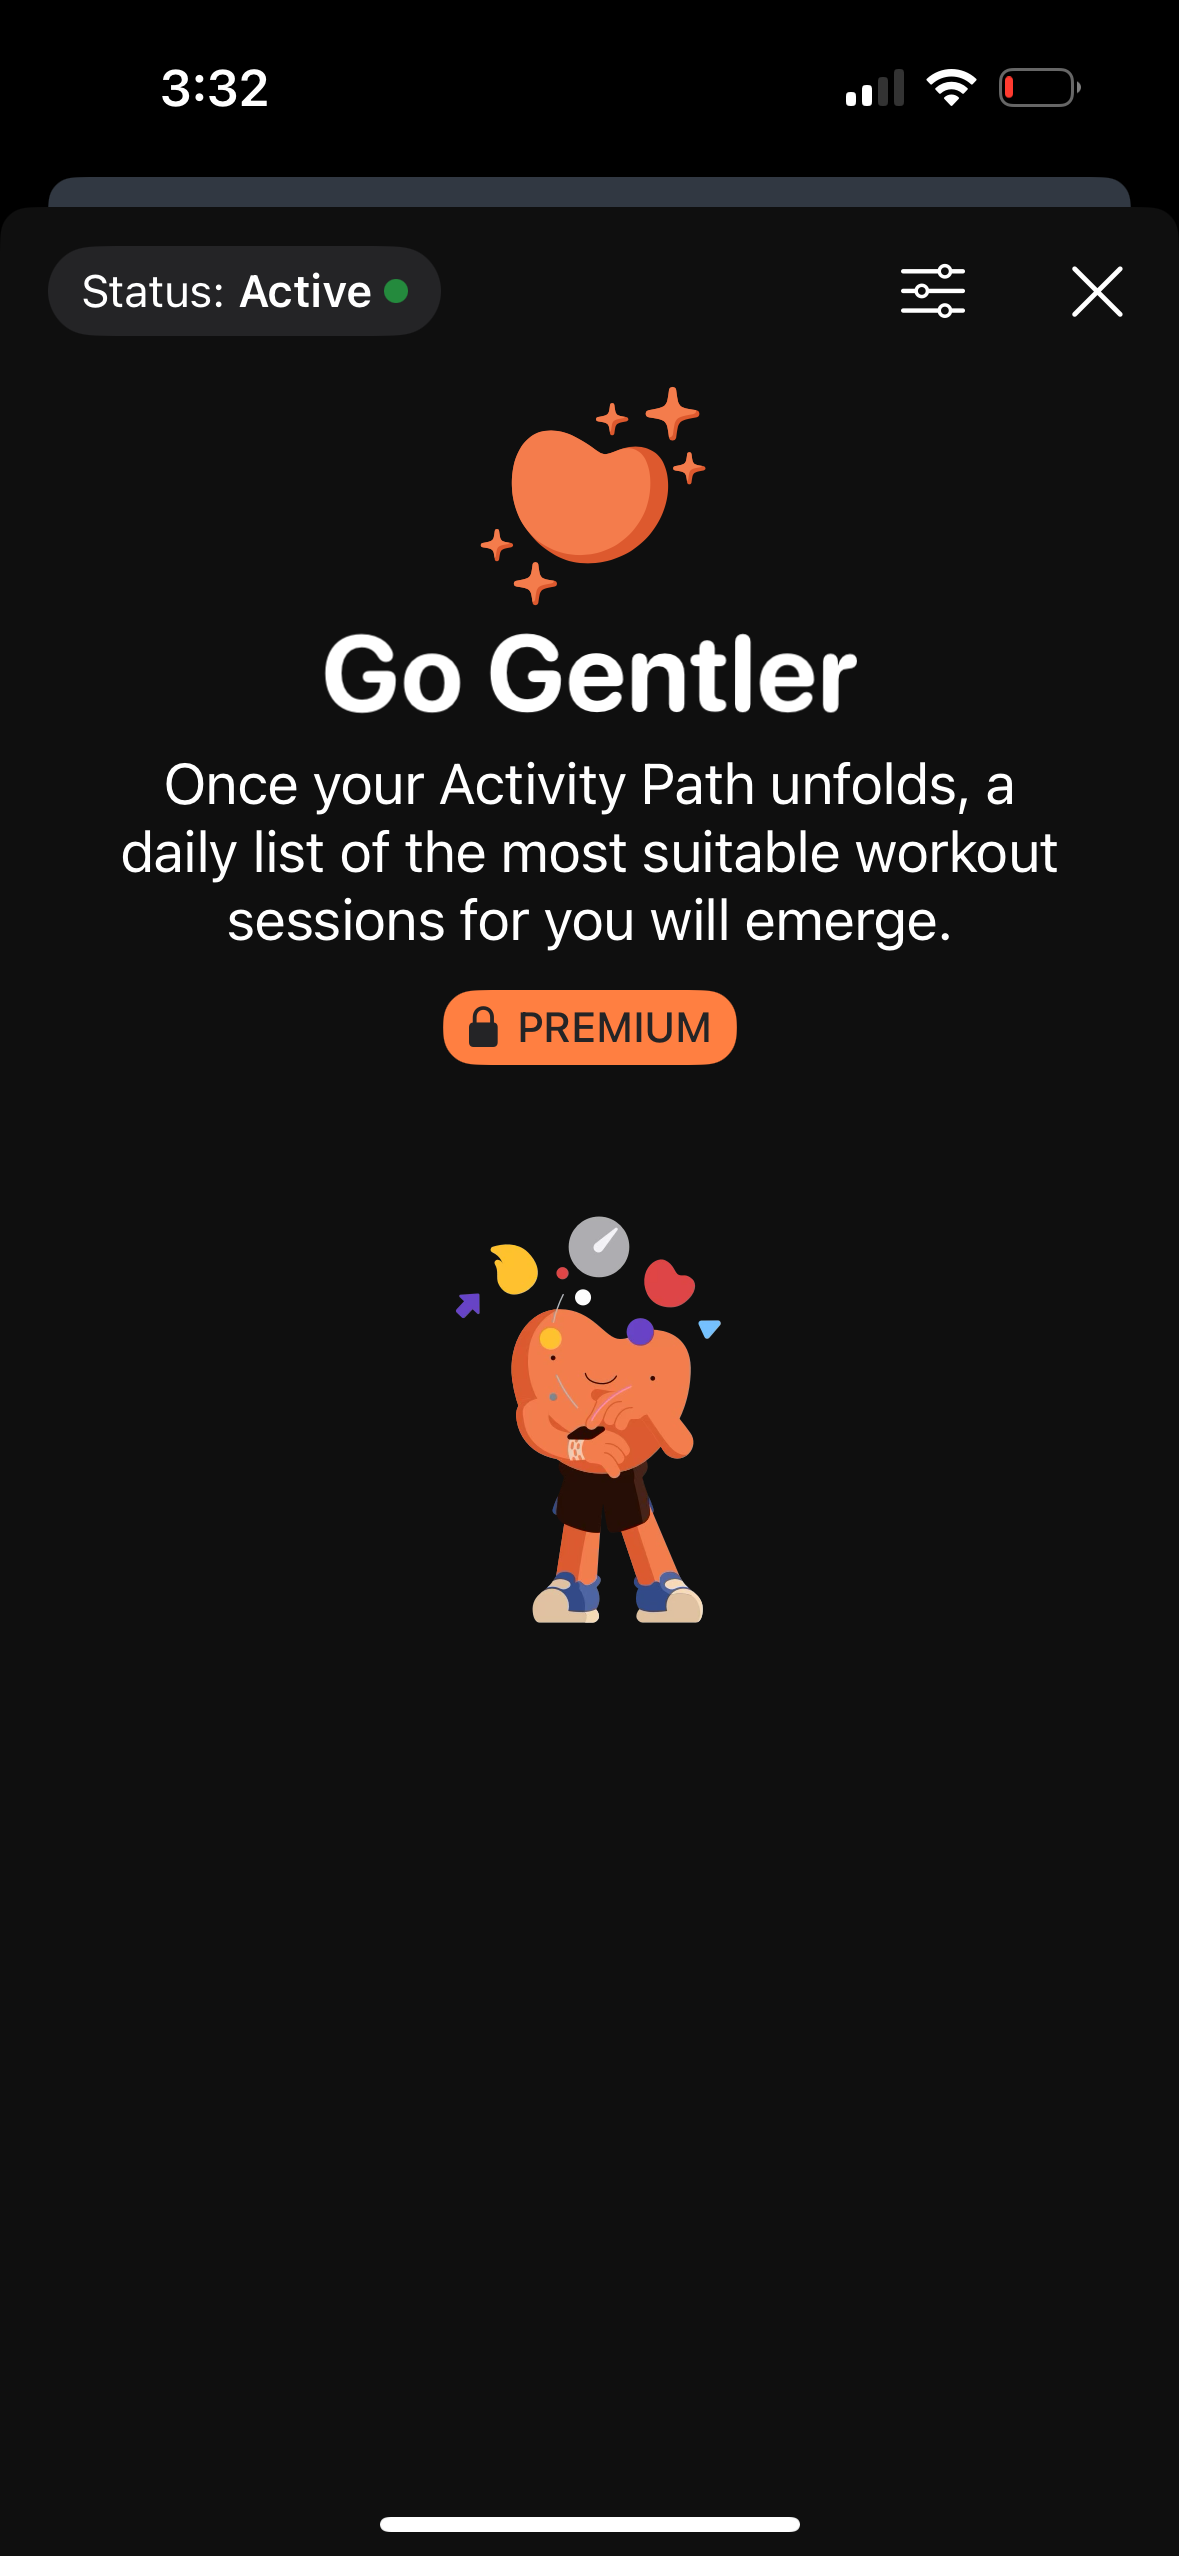
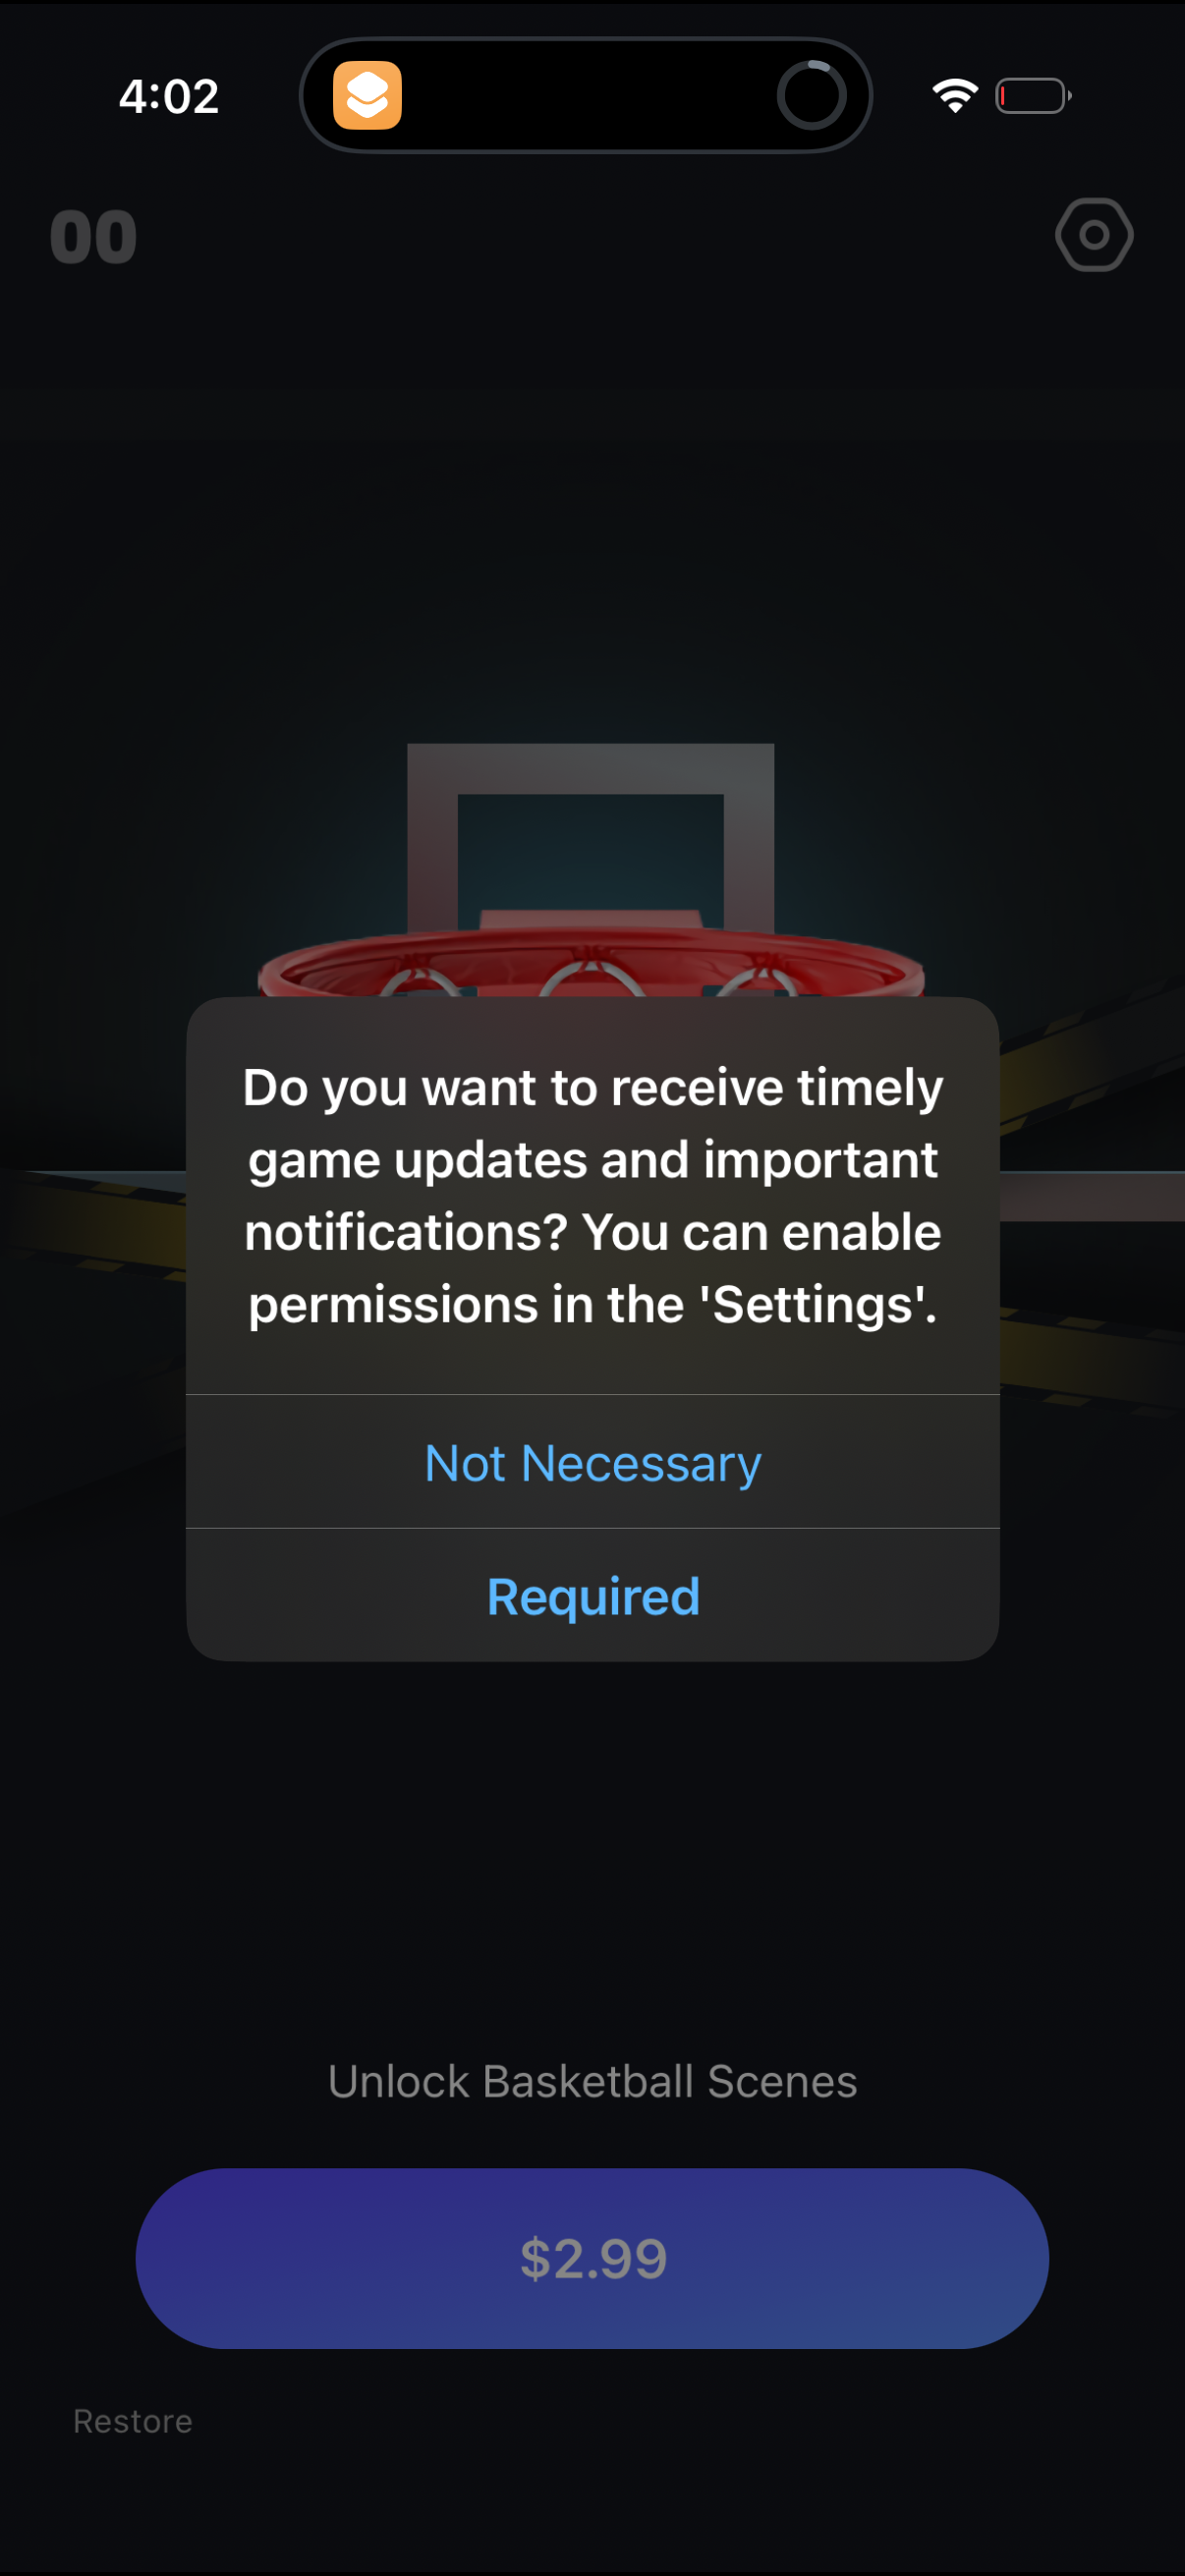
| Item | Captured checkout/payment screens |
|---|---|
| iam | 12 |
| lyft | 10 |
| uber-eats | 9 |
| amex | 8 |
| robinhood | 8 |
| zero | 7 |
| hopper | 6 |
| youtube | 4 |
| adidas | 4 |
The finding: who has the deepest captured checkout flows
Screen count is a proxy for how many distinct payment surfaces an app exposes [1].
| App | Captured checkout/payment screens |
|---|---|
| iam | 12 |
| lyft | 10 |
| uber-eats | 9 |
| amex | 8 |
| robinhood | 8 |
| zero | 7 |
| hopper | 6 |
| youtube | 4 |
| adidas | 4 |
Finance (amex, robinhood) and on-demand/travel (lyft, uber-eats, hopper) apps sit near the top, consistent with flows that involve payment method selection, confirmation, and receipts [1].
How to apply this
Use these as reference teardowns when designing a specific flow. Building a subscription checkout with plan selection? lyft's experiment moved from a $0 first month to an immediate $9.99/month price with an annual 'Save $20' upsell — a concrete example of surfacing recurring price plus plan upsell at checkout [3]. Designing an order-confirmation step? adidas's changes (explicit delivery date, free-shipping copy, payment-method row) are captured in the corpus [3]. Pick the anchor that matches your surface rather than averaging across a small, heterogeneous set.
Caveats
Screen count reflects capture depth, not checkout quality or conversion — more screens can mean a longer, more fragmented flow [2]. The set is 77 apps and iOS-weighted; the lyft and adidas examples are single-company observed changes with inferred rationale, not measured lift [3].
The numbers
| Stat | Computed from |
|---|---|
| Top checkout-screen apps: iam 12, lyft 10, uber-eats 9, amex 8, robinhood 8, zero 7, hopper 6, youtube 4, adidas 4 | top_app_checkout_companies mapping |
| 169 canonical checkout screens across 77 apps | app_checkout_canonical_screens (169 screens / 77 companies) |
| lyft moved to immediate $9.99/mo with annual 'Save $20' upsell; adidas added delivery/payment rows (observed changes) | qualitative teardowns: lyft $0-first-month -> $9.99/mo + annual upsell; adidas delivery date + payment-method row |
Sources & citations
- [1] Lazyweb Research analysis of 169 canonical checkout screens across 77 mobile apps (mobile app corpus), July 2026. Apps ranked by distinct captured checkout/payment canonical screens; top values iam 12, lyft 10, uber-eats 9. ↩
- [2] Lazyweb Research analysis of 169 canonical checkout screens across 77 mobile apps (mobile app corpus), July 2026. Small heterogeneous corpus; screen count is capture depth, not conversion or quality. ↩
- [3] Lazyweb Research analysis of 81 detected checkout experiments across 19 companies (mobile app corpus), July 2026. lyft and adidas qualitative teardowns: observed UI change + inferred rationale, not measured lift. ↩
Source: Lazyweb Research — proprietary analysis of real, in-market app screens. Cite as Lazyweb Research, 2026-07-07.