How large is the checkout-screen benchmark — mobile apps vs web?
The benchmark spans two separate corpora: 169 canonical mobile checkout/payment screens across 77 apps, and 296 labeled web checkout screens across 152 companies [1][2]. These corpora do not cover the same companies and are reported independently — never summed into one denominator. The differentiator versus a source like Baymard is the mobile-app corpus plus a detected-experiment feed.
169 mobile checkout screens (77 apps) and 296 web checkout screens (152 companies) — two separate corpora, Lazyweb Research, July 2026.
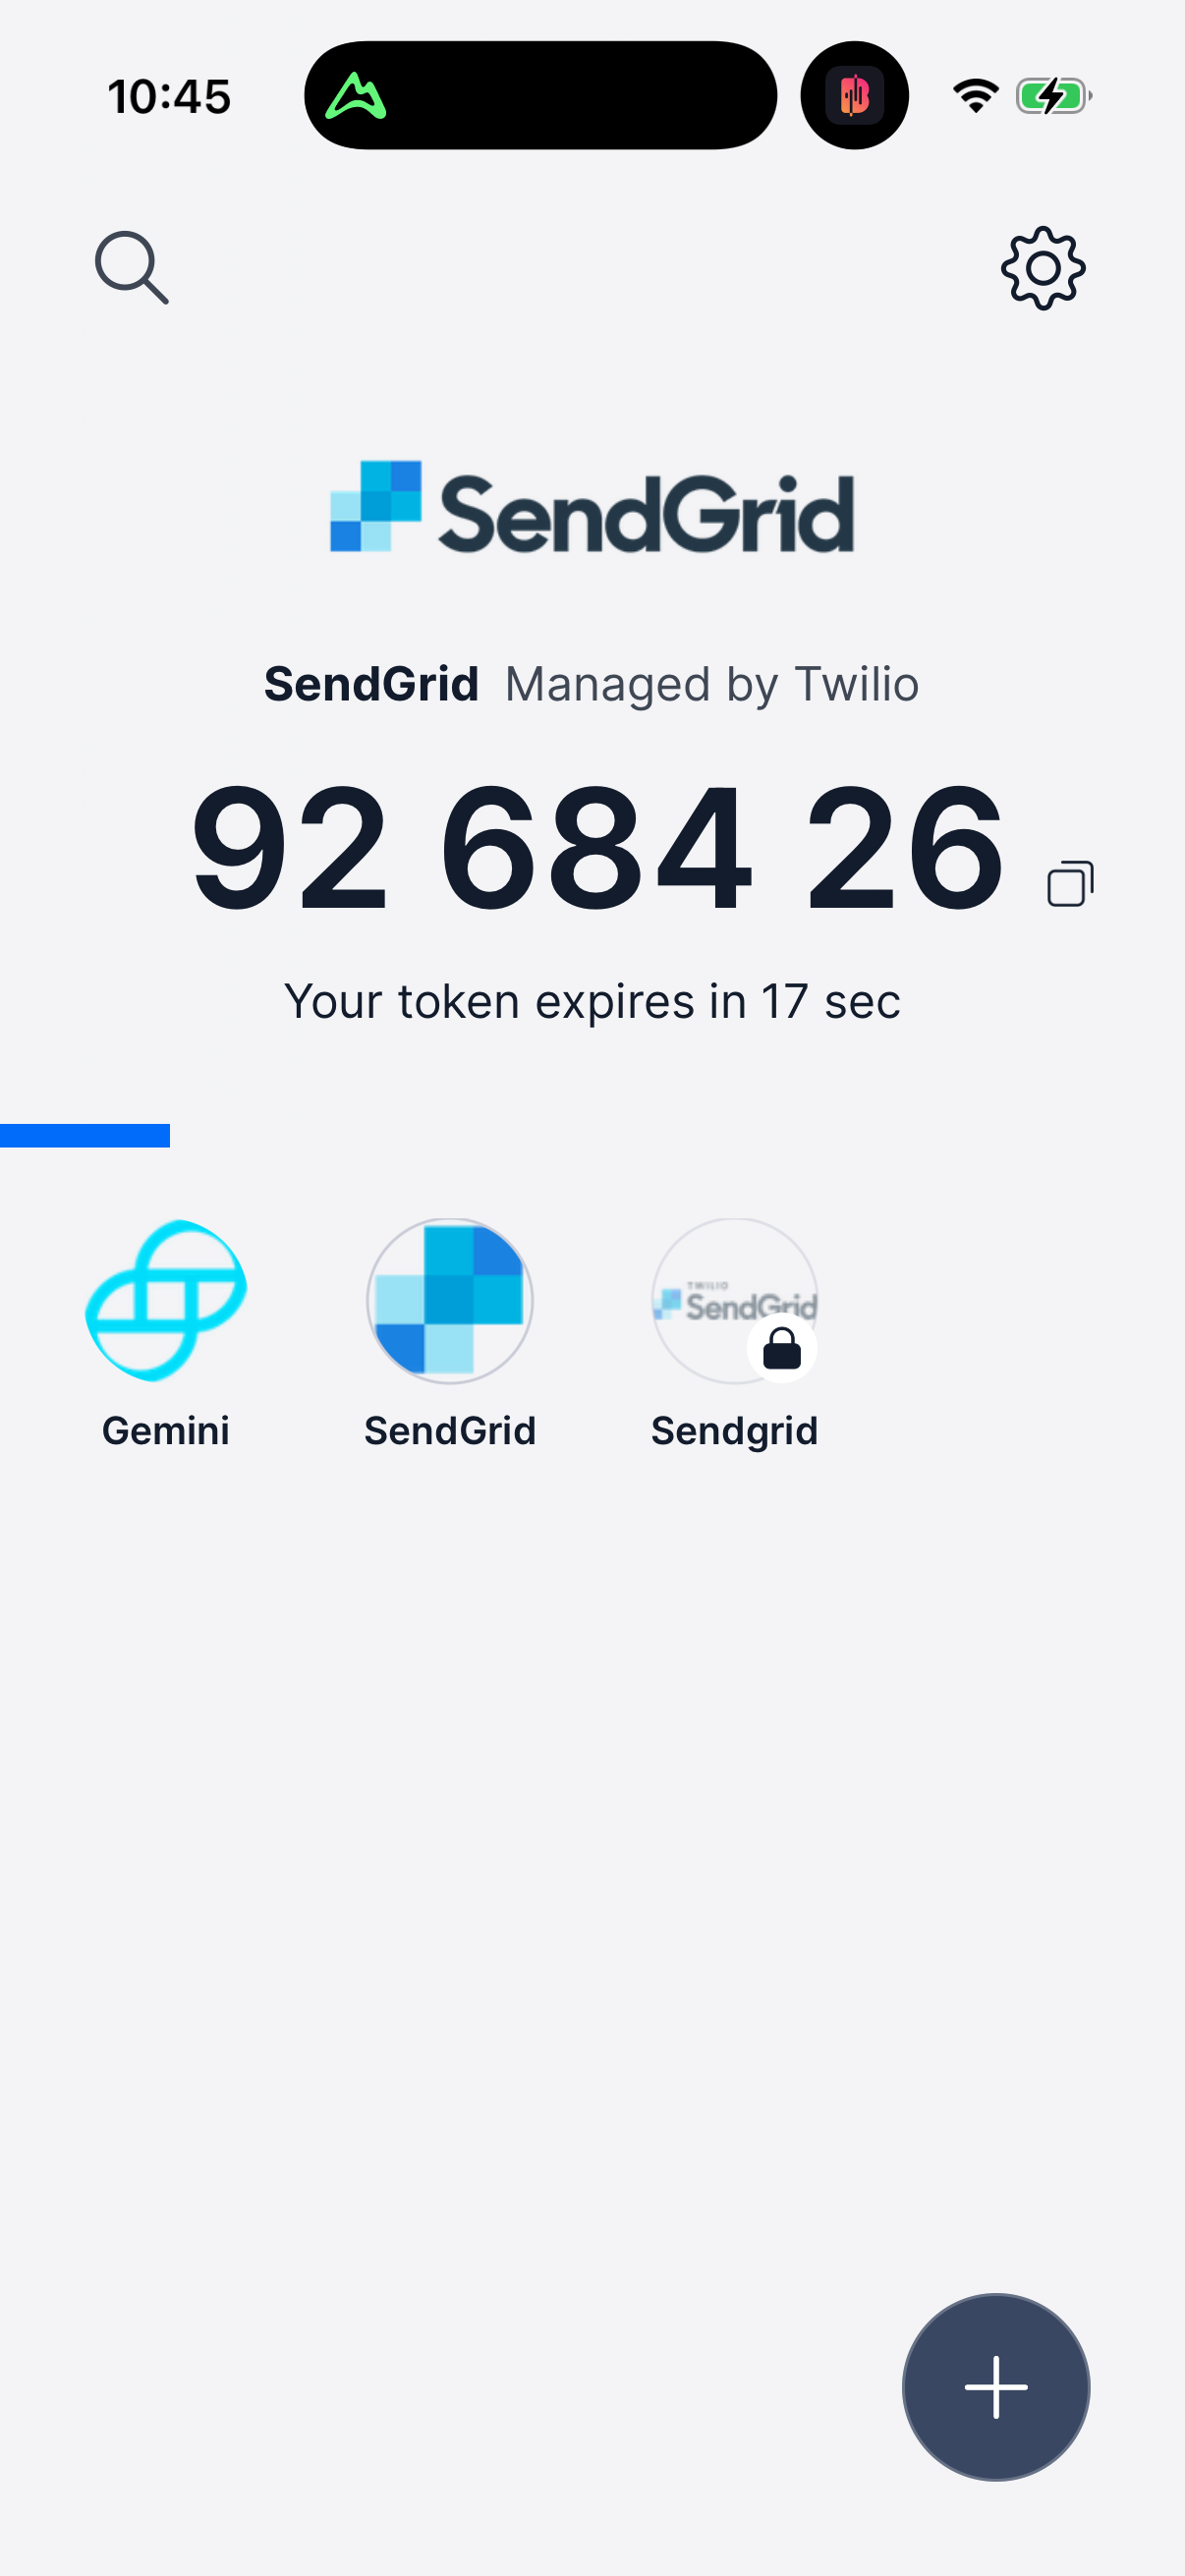

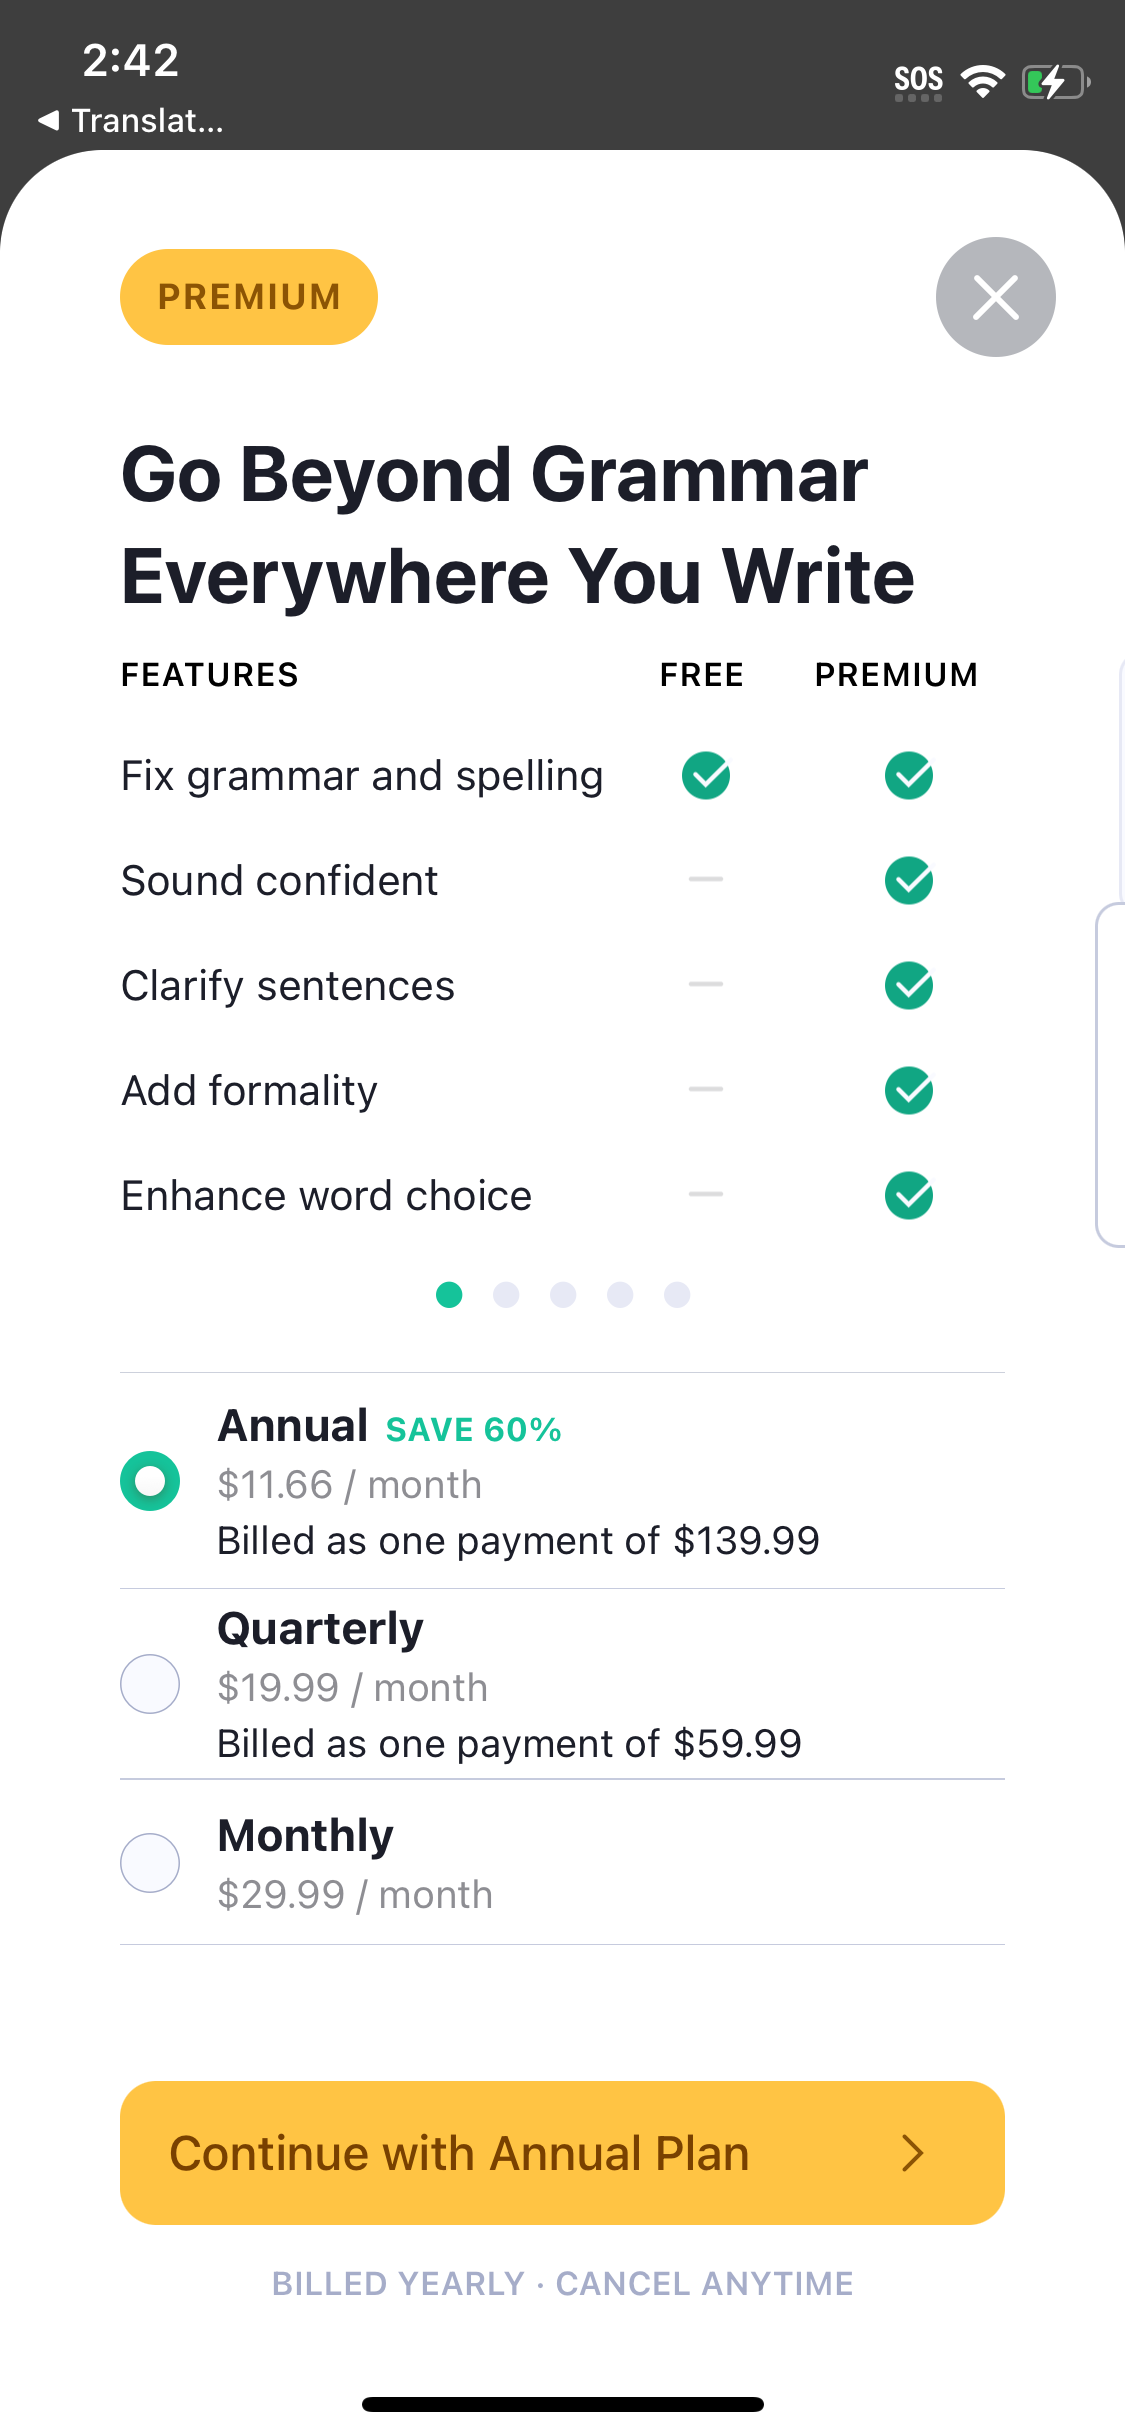
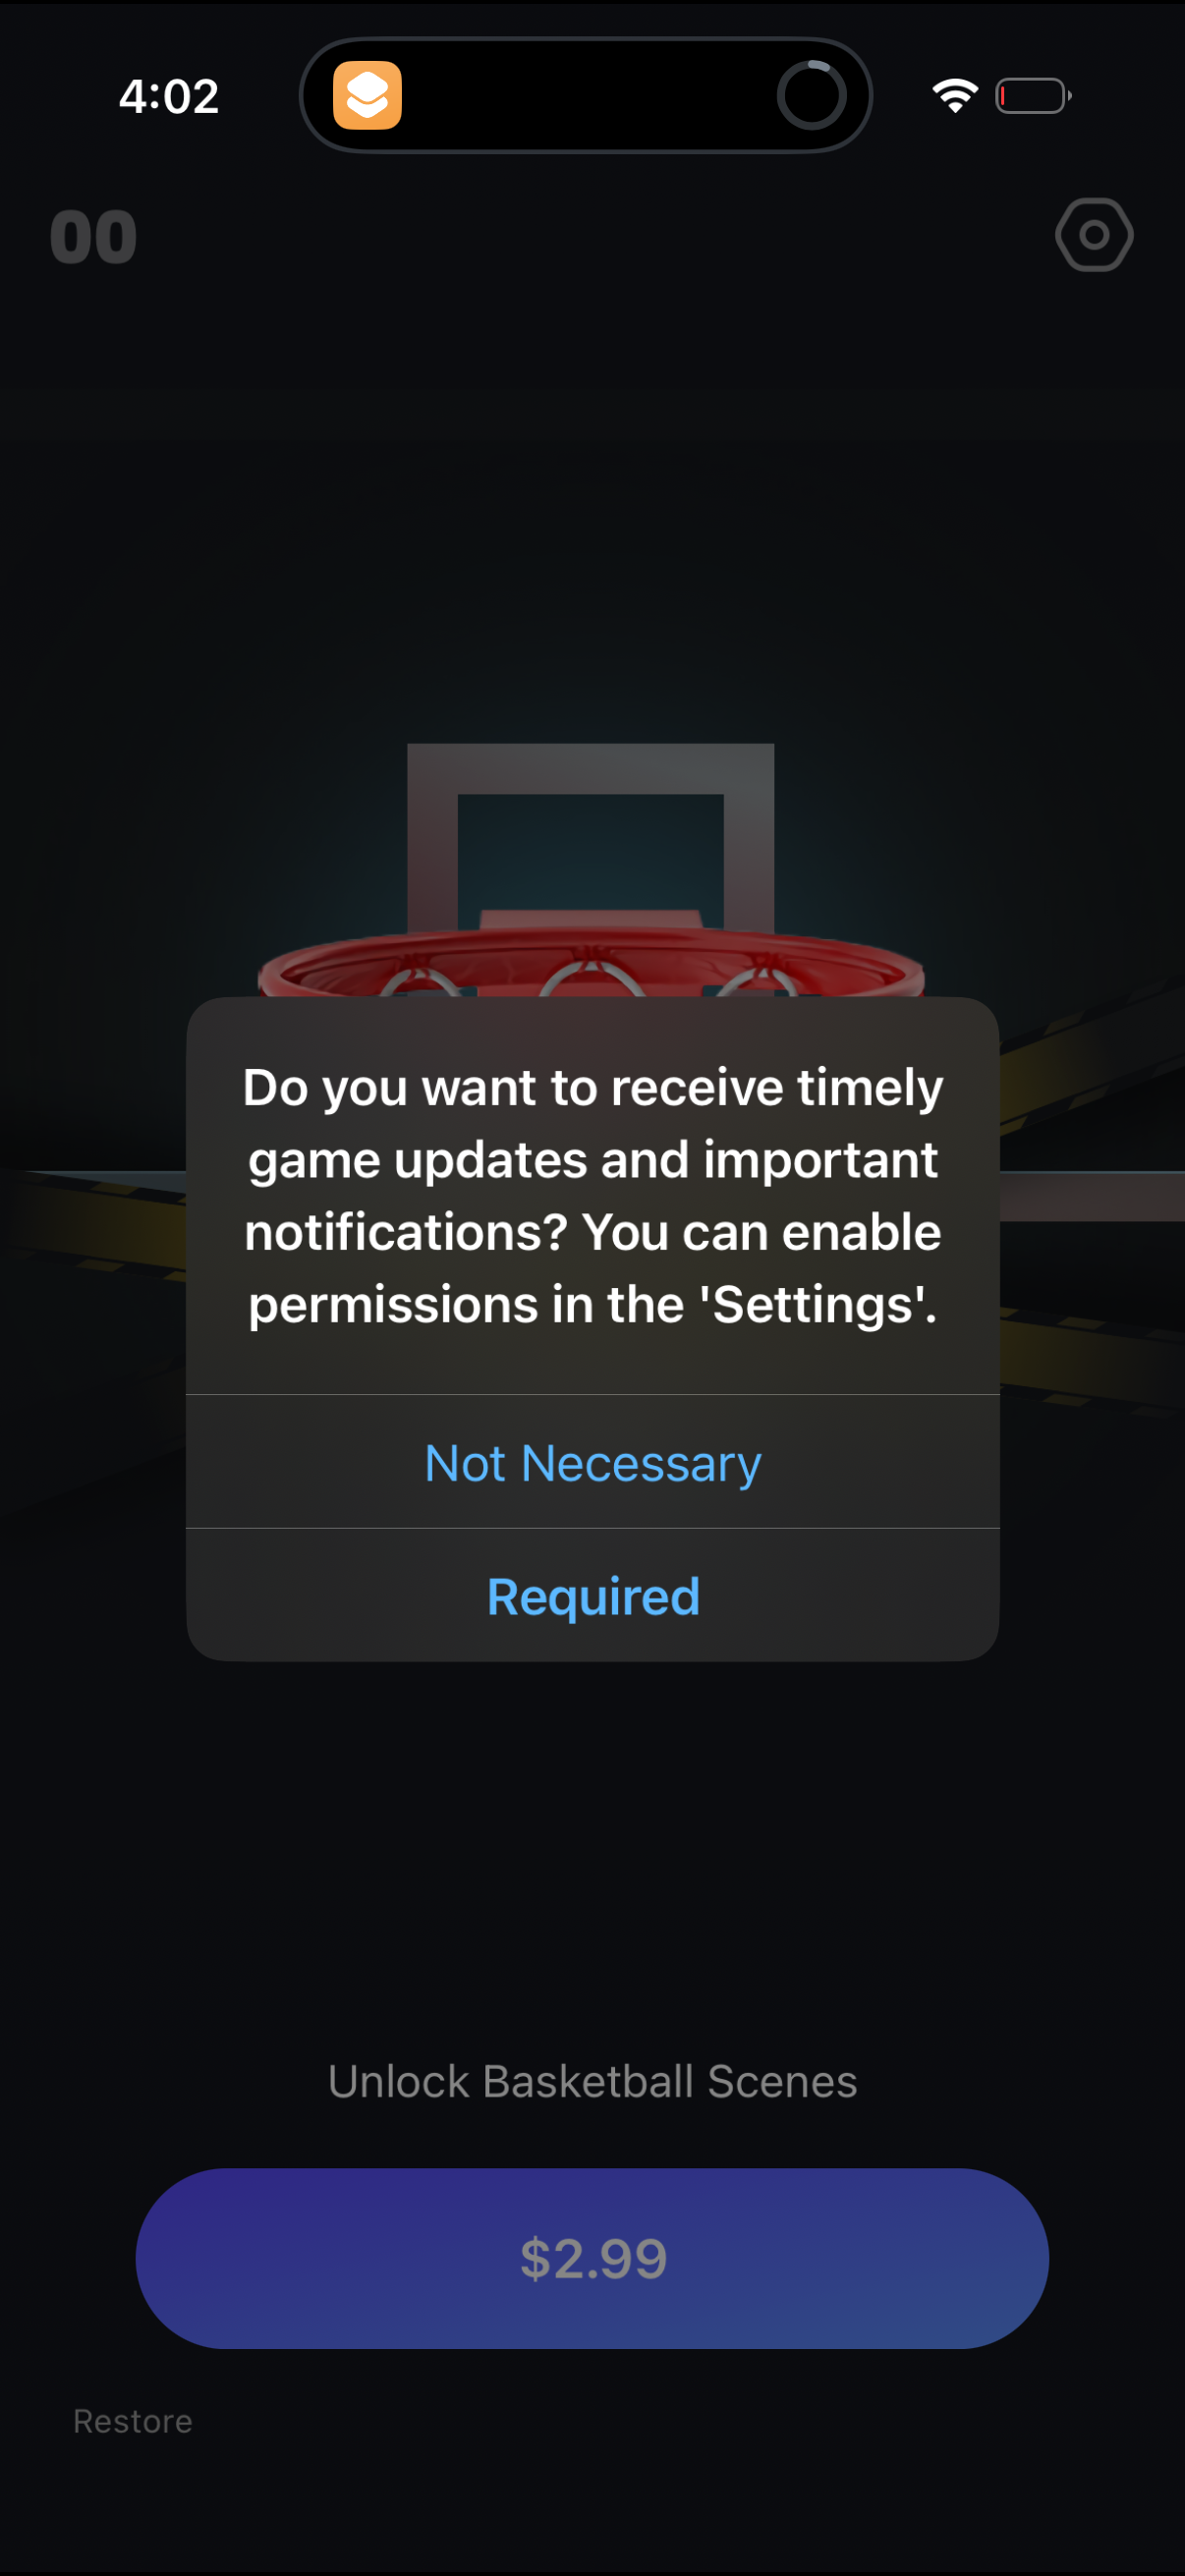
The finding: two corpora, reported separately
The checkout benchmark draws on two distinct capture pipelines that do not overlap in company coverage [1][2].
| Corpus | Checkout screens | Companies | Base universe |
|---|---|---|---|
| Mobile app (canonical) | 169 | 77 | 23,407 canonical screens |
| Web (labeled) | 296 | 152 | 11,753 site screen labels |
Because the two corpora track different companies, they are reported side by side, not combined. There is no valid '62,376 companies' denominator for this family [1][2].
How to apply this
Use the mobile corpus for element-level questions (payment methods, promo fields, upsell placement) because those screens have vision descriptions. Treat the web corpus as a count-only census: 296 labeled checkout screens across 152 companies tells you coverage exists, but web checkout element details (trust badges, express-pay, guest checkout) are not reliably extractable, so do not expect web-specific percentages from this benchmark [2]. When you cite the family, lead with absolute counts and named screenshot examples rather than percentages — every vertical in both corpora is small-n [1][2].
Caveats
Only 53 of the 152 web checkout companies have any vision rows, and those are mobile captures — so the web corpus supports a screen/company census but not element-level web percentages [2]. Both corpora are small-n overall (169 mobile screens; 296 web screens), which is why this family reports counts and examples over rates [1].
The numbers
| Stat | Computed from |
|---|---|
| 169 mobile canonical checkout screens across 77 apps (of 23,407 canonical screens) | app_checkout_canonical_screens (169/23,407, 77 companies) |
| 296 labeled web checkout screens across 152 companies (of 11,753 site screen labels); only 53 of 152 have any vision rows | web_checkout_screens (296/11,753), web_checkout_companies (152), smallSampleWarnings (53 of 152 have vision rows) |
Sources & citations
- [1] Lazyweb Research analysis of 169 canonical checkout screens across 77 mobile apps (mobile app corpus), July 2026. 169 canonical checkout/payment/cart screens across 77 apps within 23,407 canonical screens. ↩
- [2] Lazyweb Research analysis of 296 labeled checkout screens across 152 companies (web corpus), July 2026. 296 'checkout' screen_type labels across 152 companies within 11,753 site screen labels; only 53 of 152 have vision rows, so web element-level percentages are not published. ↩
Source: Lazyweb Research — proprietary analysis of real, in-market app screens. Cite as Lazyweb Research, 2026-07-07.