Where do freemium apps place upgrade prompts inside the product?
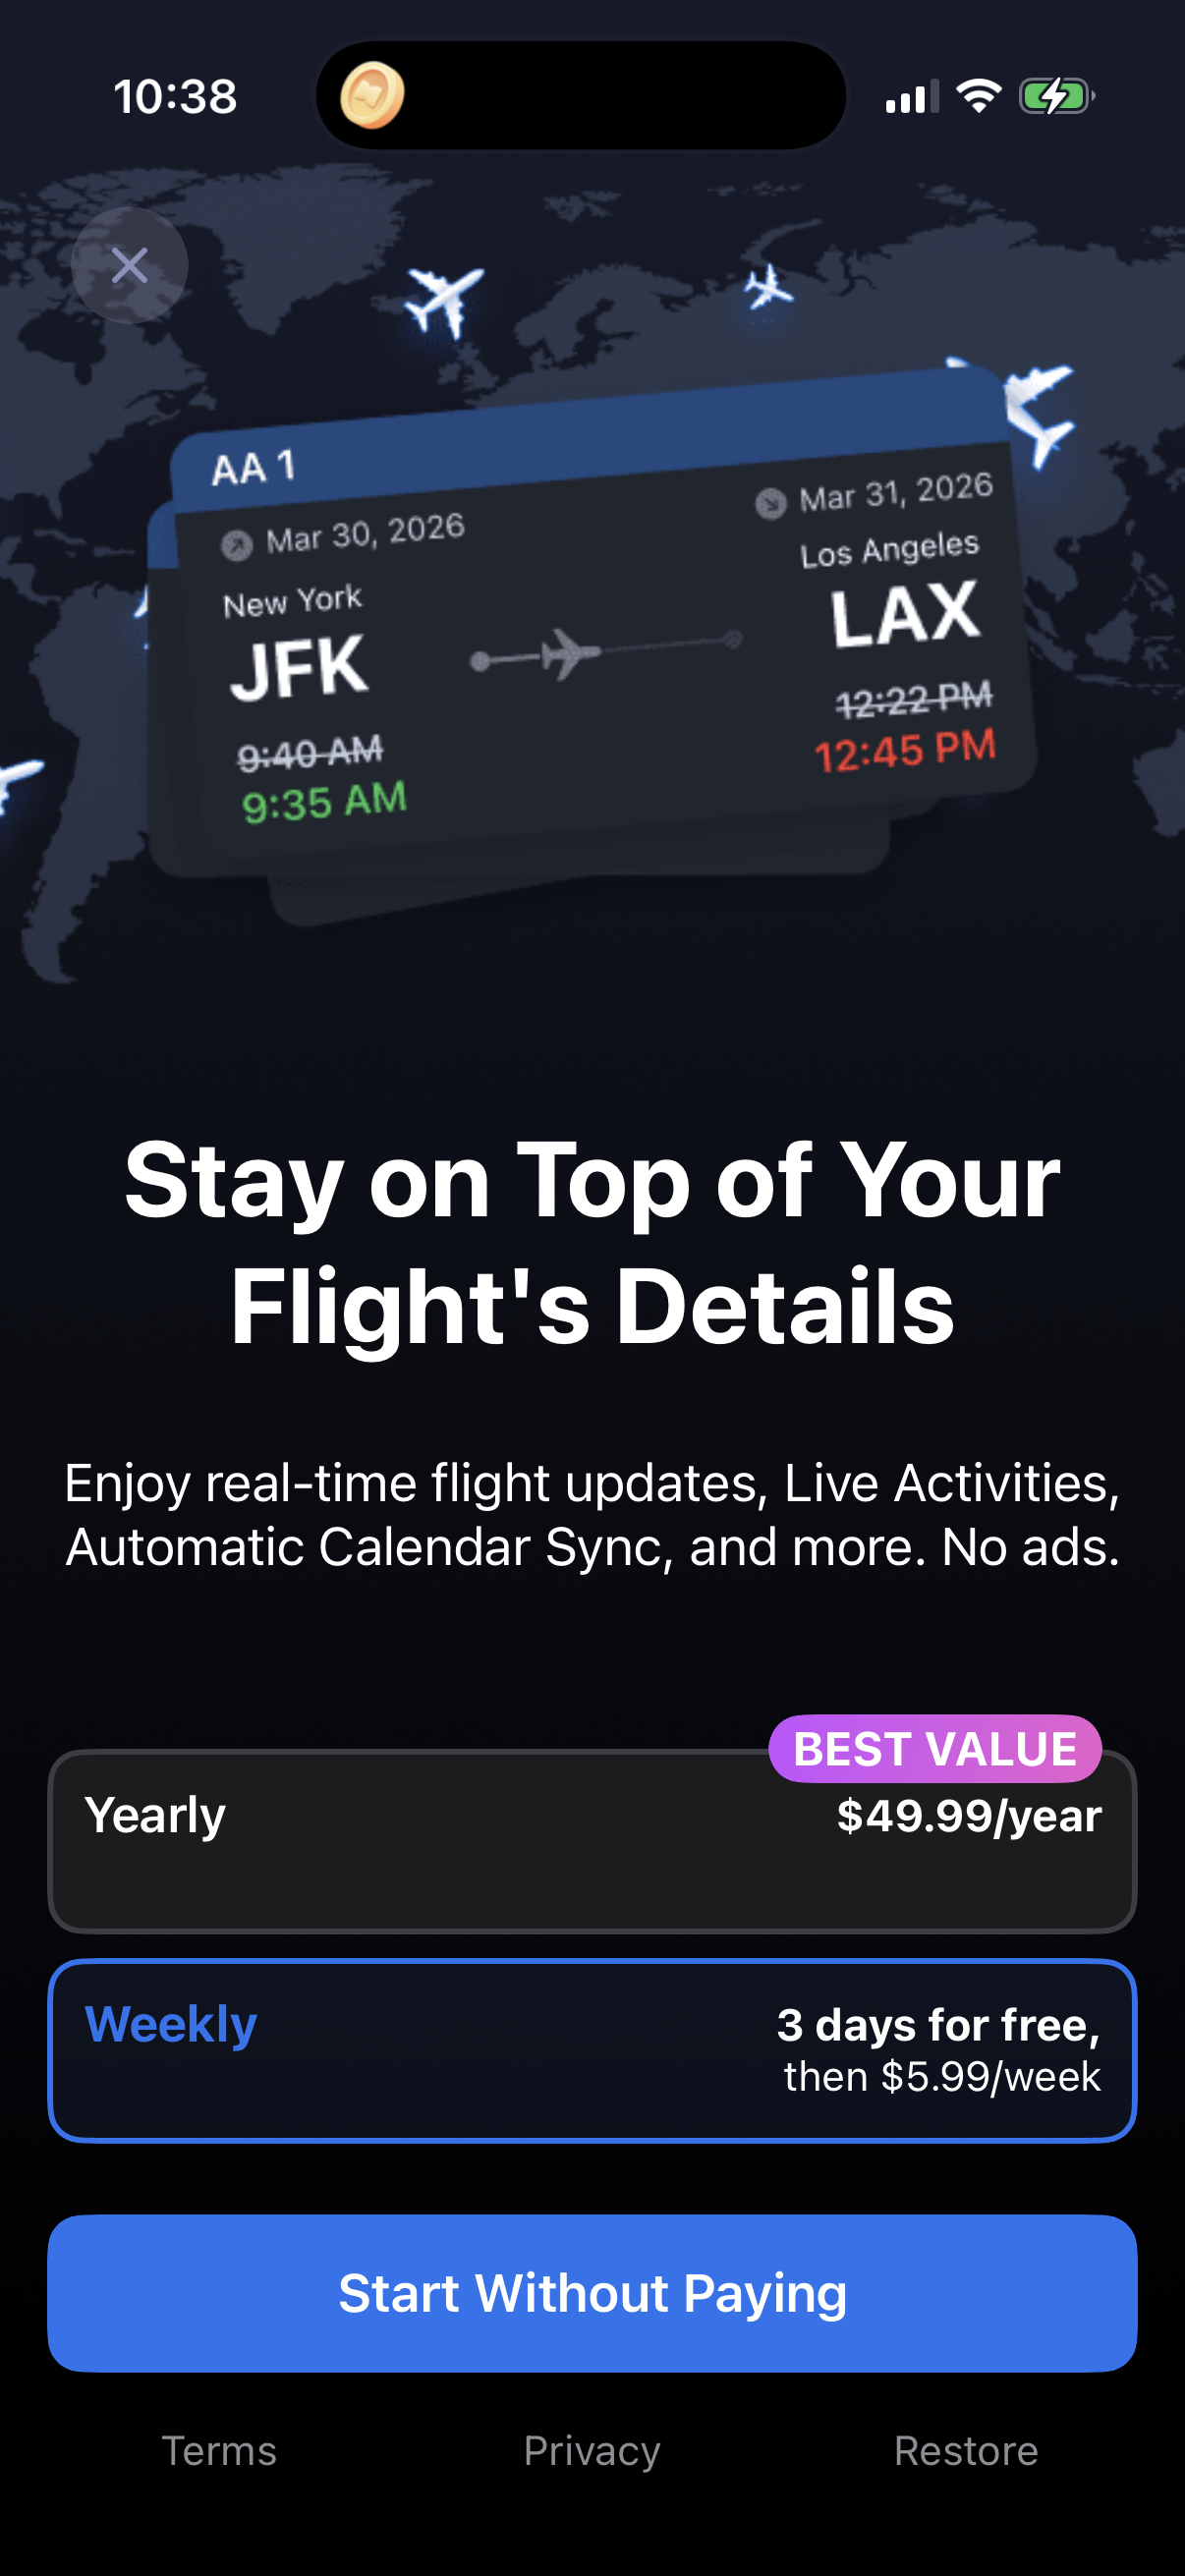
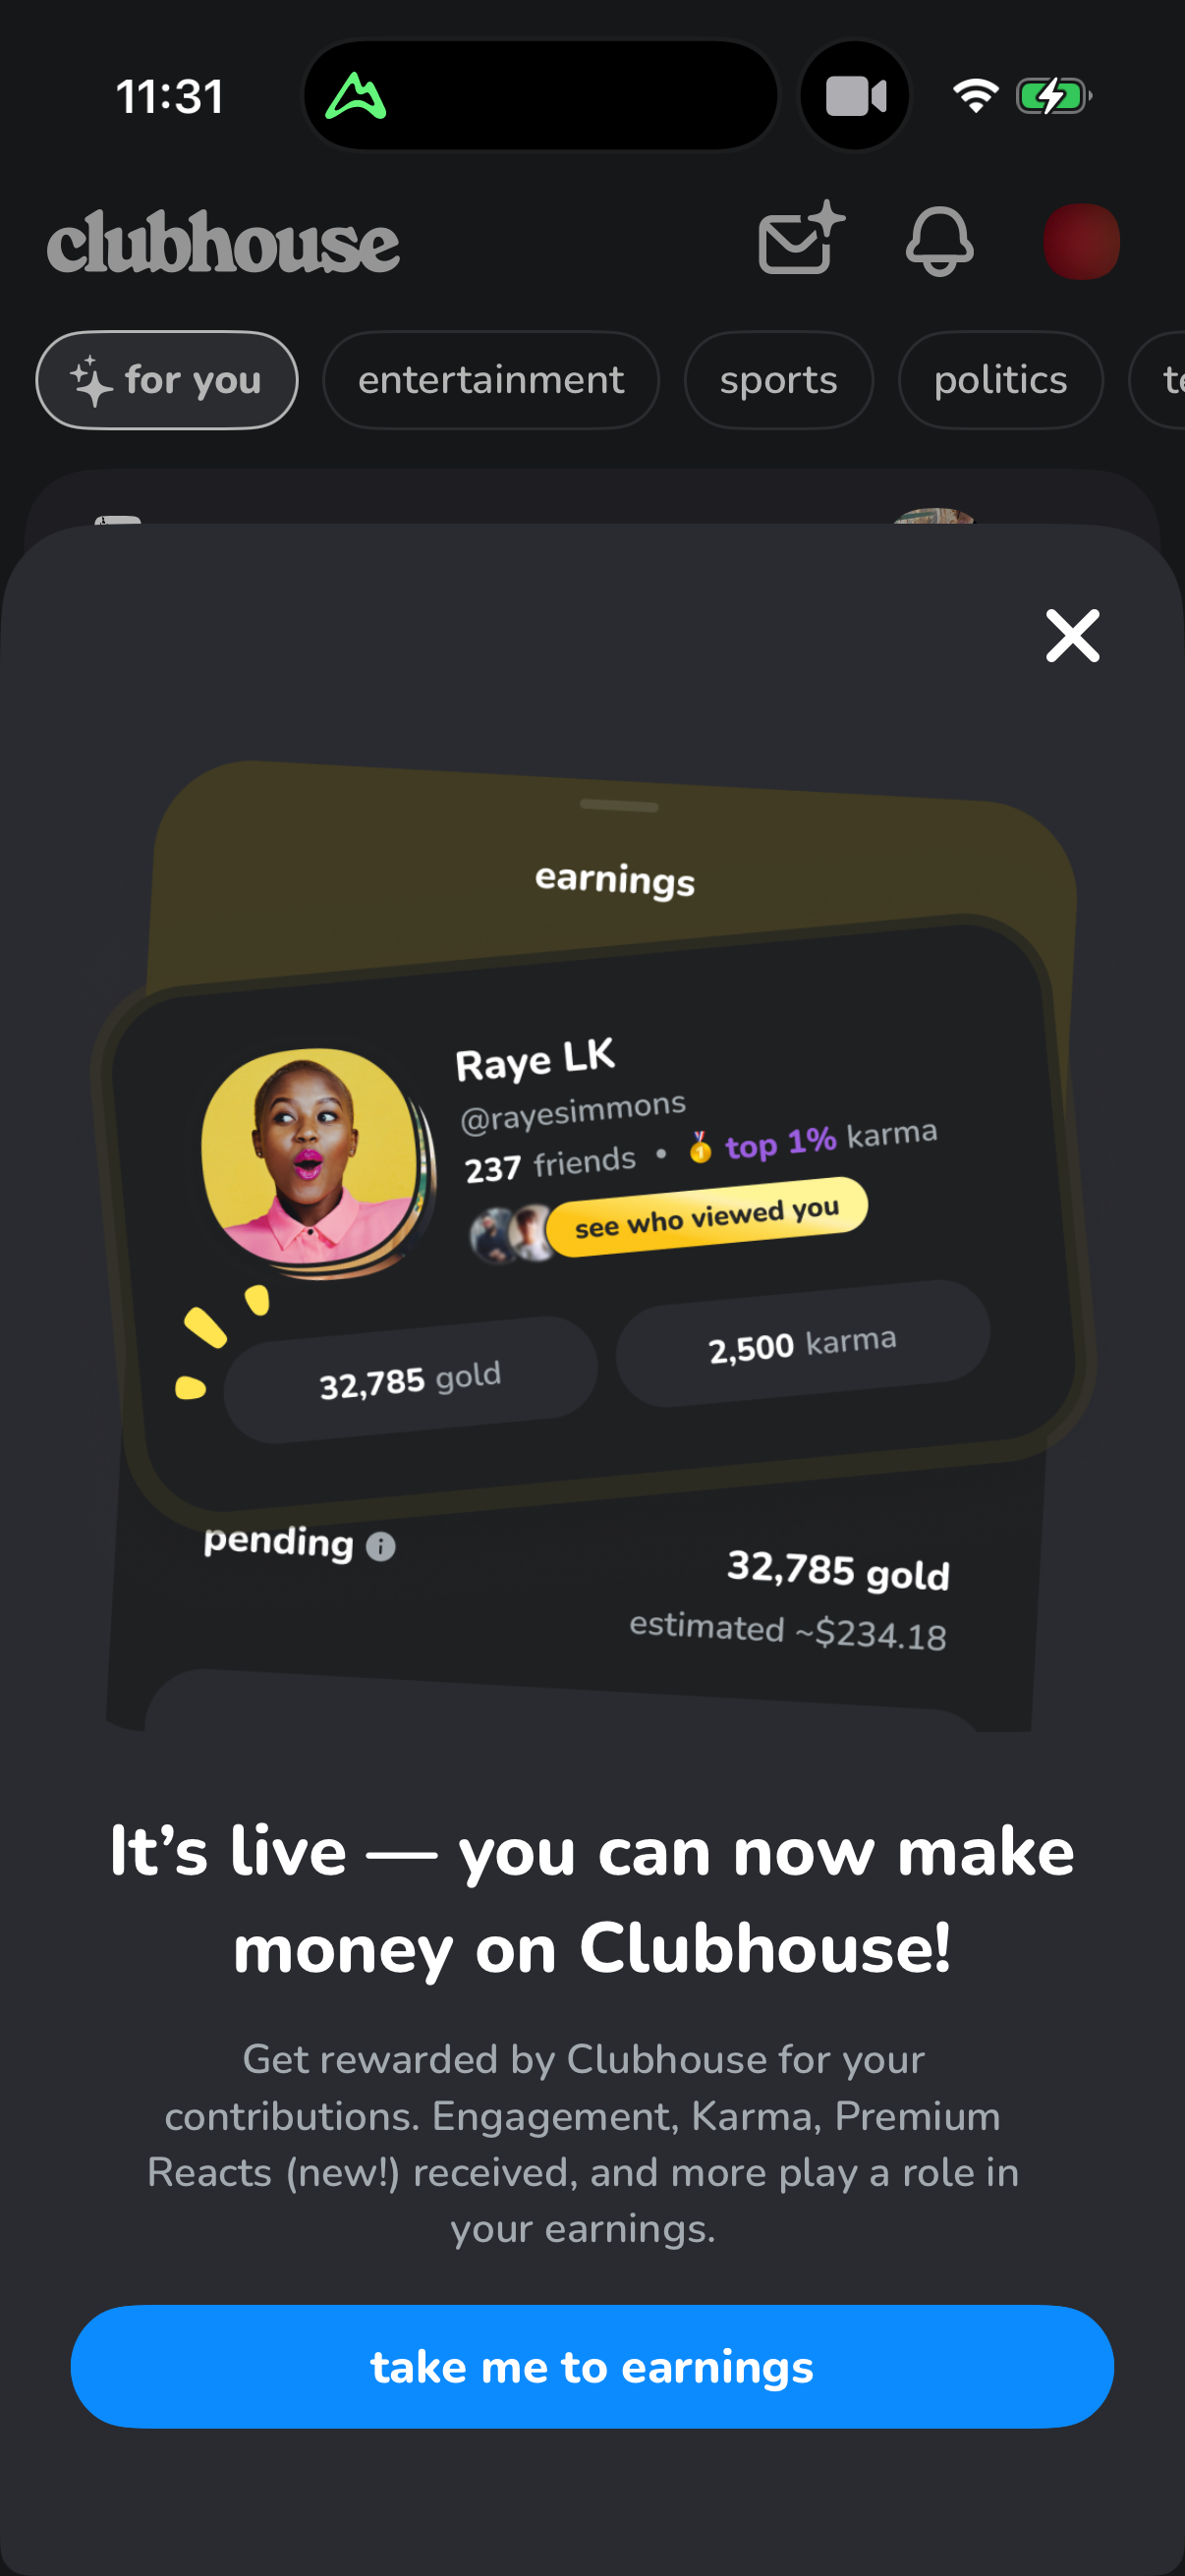
Across 809 tracked mobile apps, the most common in-product upgrade placement is an upgrade banner or prompt, present in 34% (271/809) of apps.[1] A premium/pro badge on a gated feature (22%, 176/809) and an explicit 'unlock' CTA (20%, 159/809) come next, while dedicated settings-screen upgrade entry points appear on 35% of the apps that have a captured settings screen (112/321).[1][3] Placement clusters around three anchors: the main feed/banner slot, the feature the user just tapped, and the account/settings surface.
34% of tracked mobile apps (271/809) surface an in-product upgrade banner or prompt — Lazyweb Research, July 2026.
| Item | Share of 809 |
|---|---|
| Upgrade banner / prompt | 34% |
| Premium / pro badge on a feature | 22% |
| Unlock CTA | 20% |
| Lock-icon gating | 12% |
| Dedicated upsell banner/card | 9% |
| Usage-meter / limit gate | 5% |
Finding: three dominant placements
In-product upgrade prompts concentrate in a small number of surfaces. Ranked by how many of the 809 tracked apps use each mechanic:[1][3]
| Placement / mechanic | Apps | Share of 809 |
|---|---|---|
| Upgrade banner / prompt | 271 | 34% |
| Premium / pro badge on a feature | 176 | 22% |
| Unlock CTA | 159 | 20% |
| Lock-icon gating | 94 | 12% |
| Dedicated upsell banner/card | 71 | 9% |
| Usage-meter / limit gate | 44 | 5% |
Separately, of the 321 apps with a captured settings/account/profile screen, 35% (112) put an upgrade/premium/subscribe entry point on it.[3]
How to apply
Treat the banner slot, the feature-tap moment, and the settings surface as your default three placements — they cover where the market already trains users to look. A banner/prompt is the single highest-coverage pattern (34%), so it's the safest first bet if you can only build one. Layer a settings-screen upgrade entry (35% of apps with settings do this) because it is low-friction and always available, unlike a contextual gate that only fires on specific actions.
Caveats
All shares are lower bounds: they come from LLM synonym tags, deduped by distinct company.[1] Raw single-word matches like %lock% (408 companies) were rejected because they are dominated by security auto-lock and lock-screen media controls; the tightened lock-gating pattern yields 94 apps.[1] Do not read these as mutually exclusive — one app can use several placements.
The numbers
| Stat | Computed from |
|---|---|
| 34% (271/809) | upgrade_banner_prompt_prevalence: 271/809 |
| 22% (176/809) | premium_badge_label_prevalence: 176/809 |
| 20% (159/809) | unlock_cta_prevalence: 159/809 |
| 12% (94/809) | lock_icon_gating_prevalence: 94/809 |
| 9% (71/809) | in_product_upsell_banner_card_prevalence: 71/809 |
| 5% (44/809) | usage_meter_limit_gating_prevalence: 44/809 |
| 35% (112/321) | upgrade_entry_in_settings: 112/321 |
| 408 companies (rejected) | lock_icon_gating_prevalence sql note: raw %lock% = 408 companies, rejected |
Sources & citations
- [1] Lazyweb Research analysis of 809 apps (tracked mobile app corpus with screenshots), July 2026. Prevalence deduped by COUNT(DISTINCT company_name) over 44,873 tagged screenshots; tag patterns are LLM synonym phrases (tightened after spot-checking) so every stat is a lower bound. ↩
- [3] Lazyweb Research analysis of 23,407 canonical mobile screens (tracked app corpus), July 2026. Canonical-screen category counts; is_paywall is NULL on 21,824/23,407 rows so gating is reported as app-count prevalence or absolute screen counts, never as a share of all screens. ↩
Source: Lazyweb Research — proprietary analysis of real, in-market app screens. Cite as Lazyweb Research, 2026-07-07.