How aggressive are subscription apps with in-product upsells?
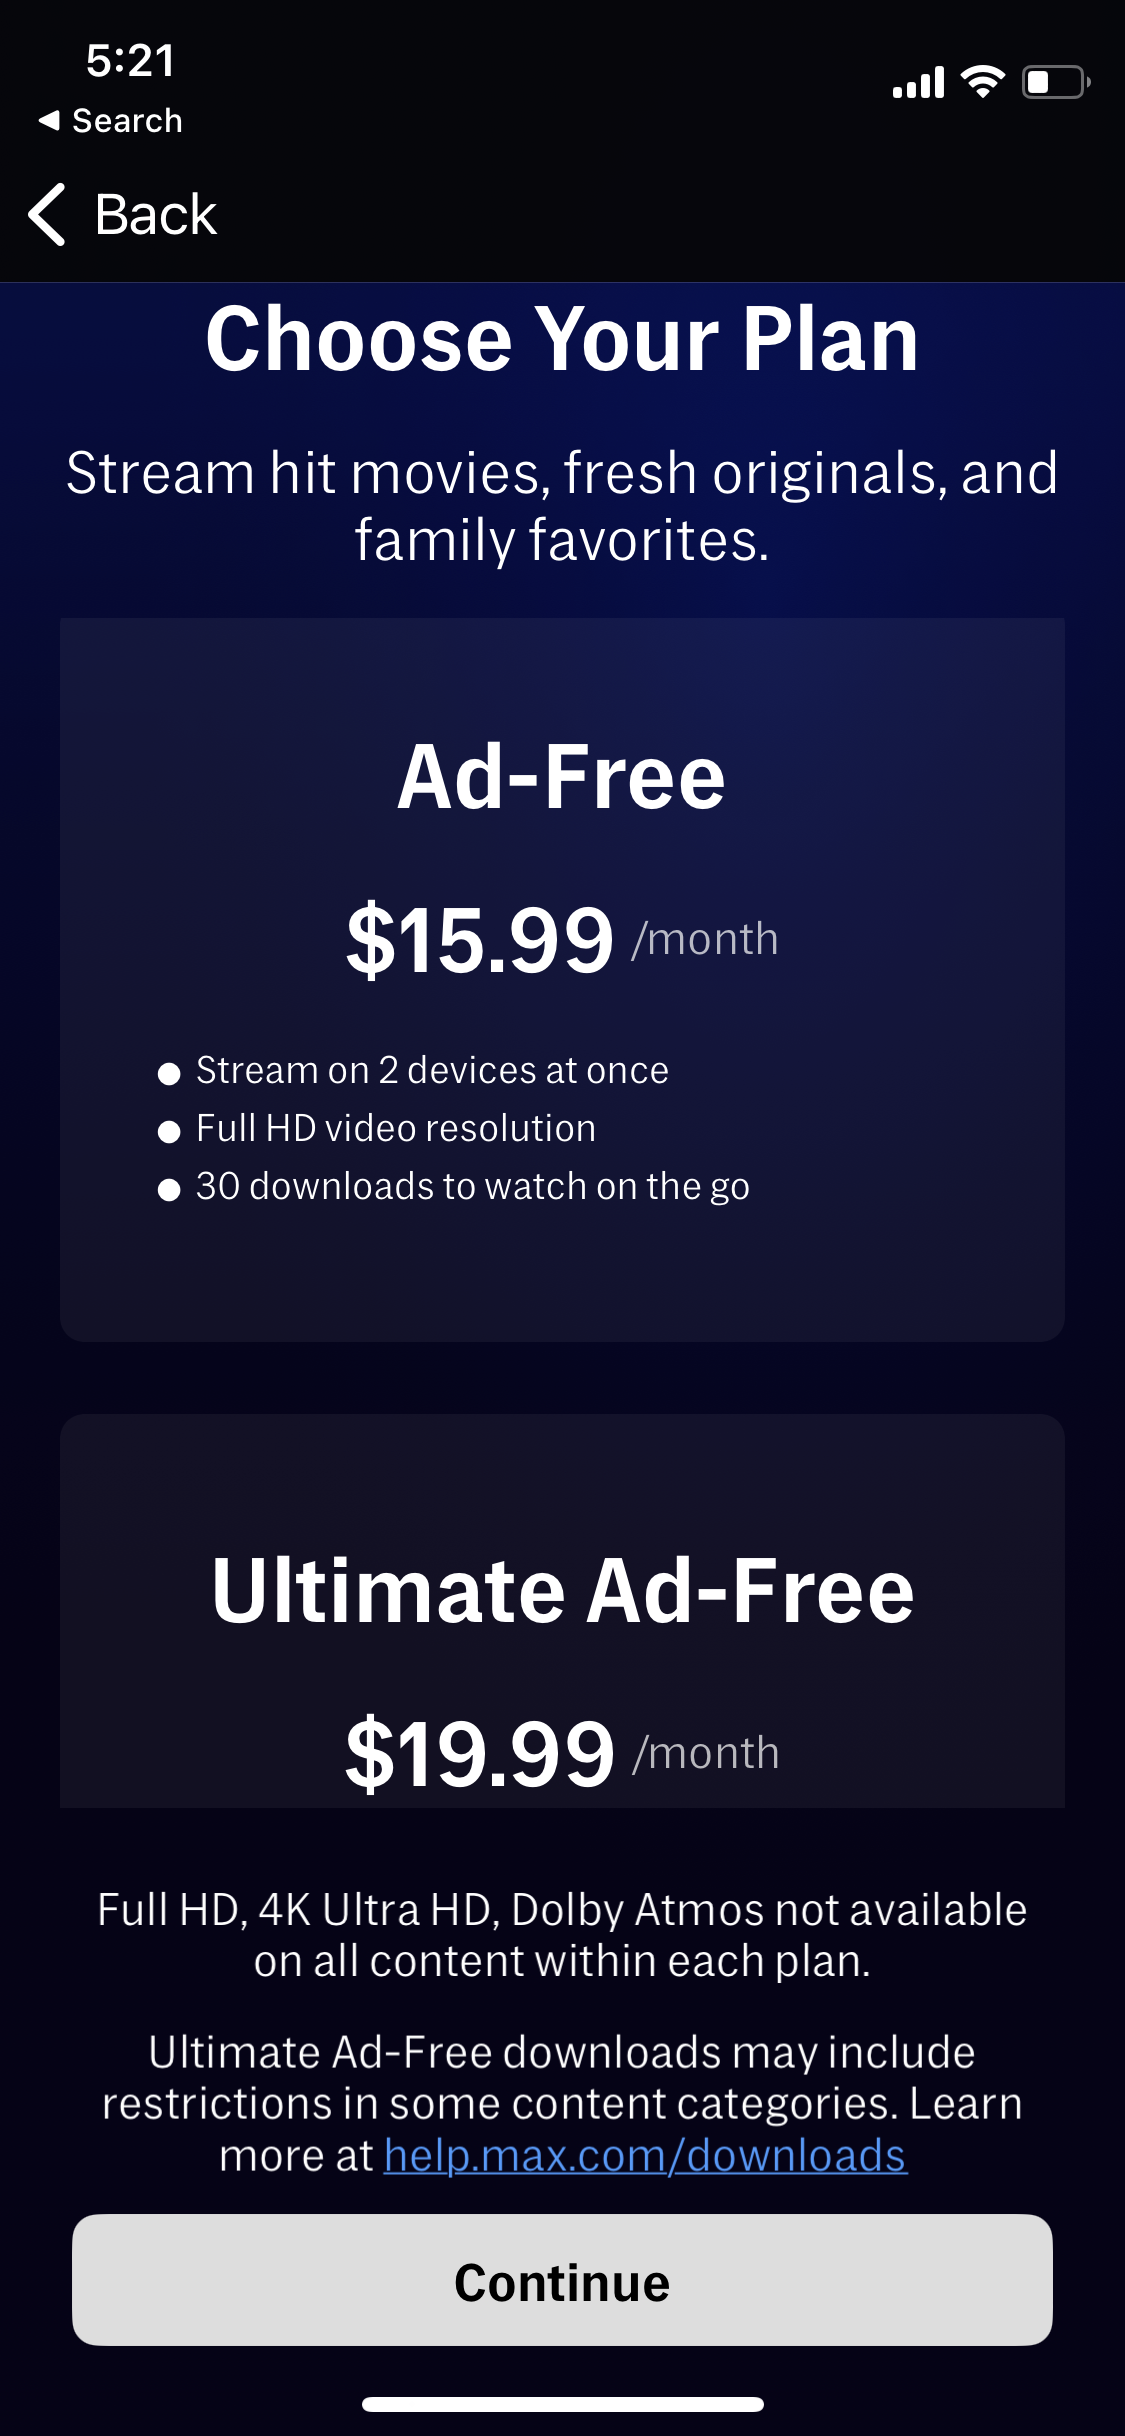
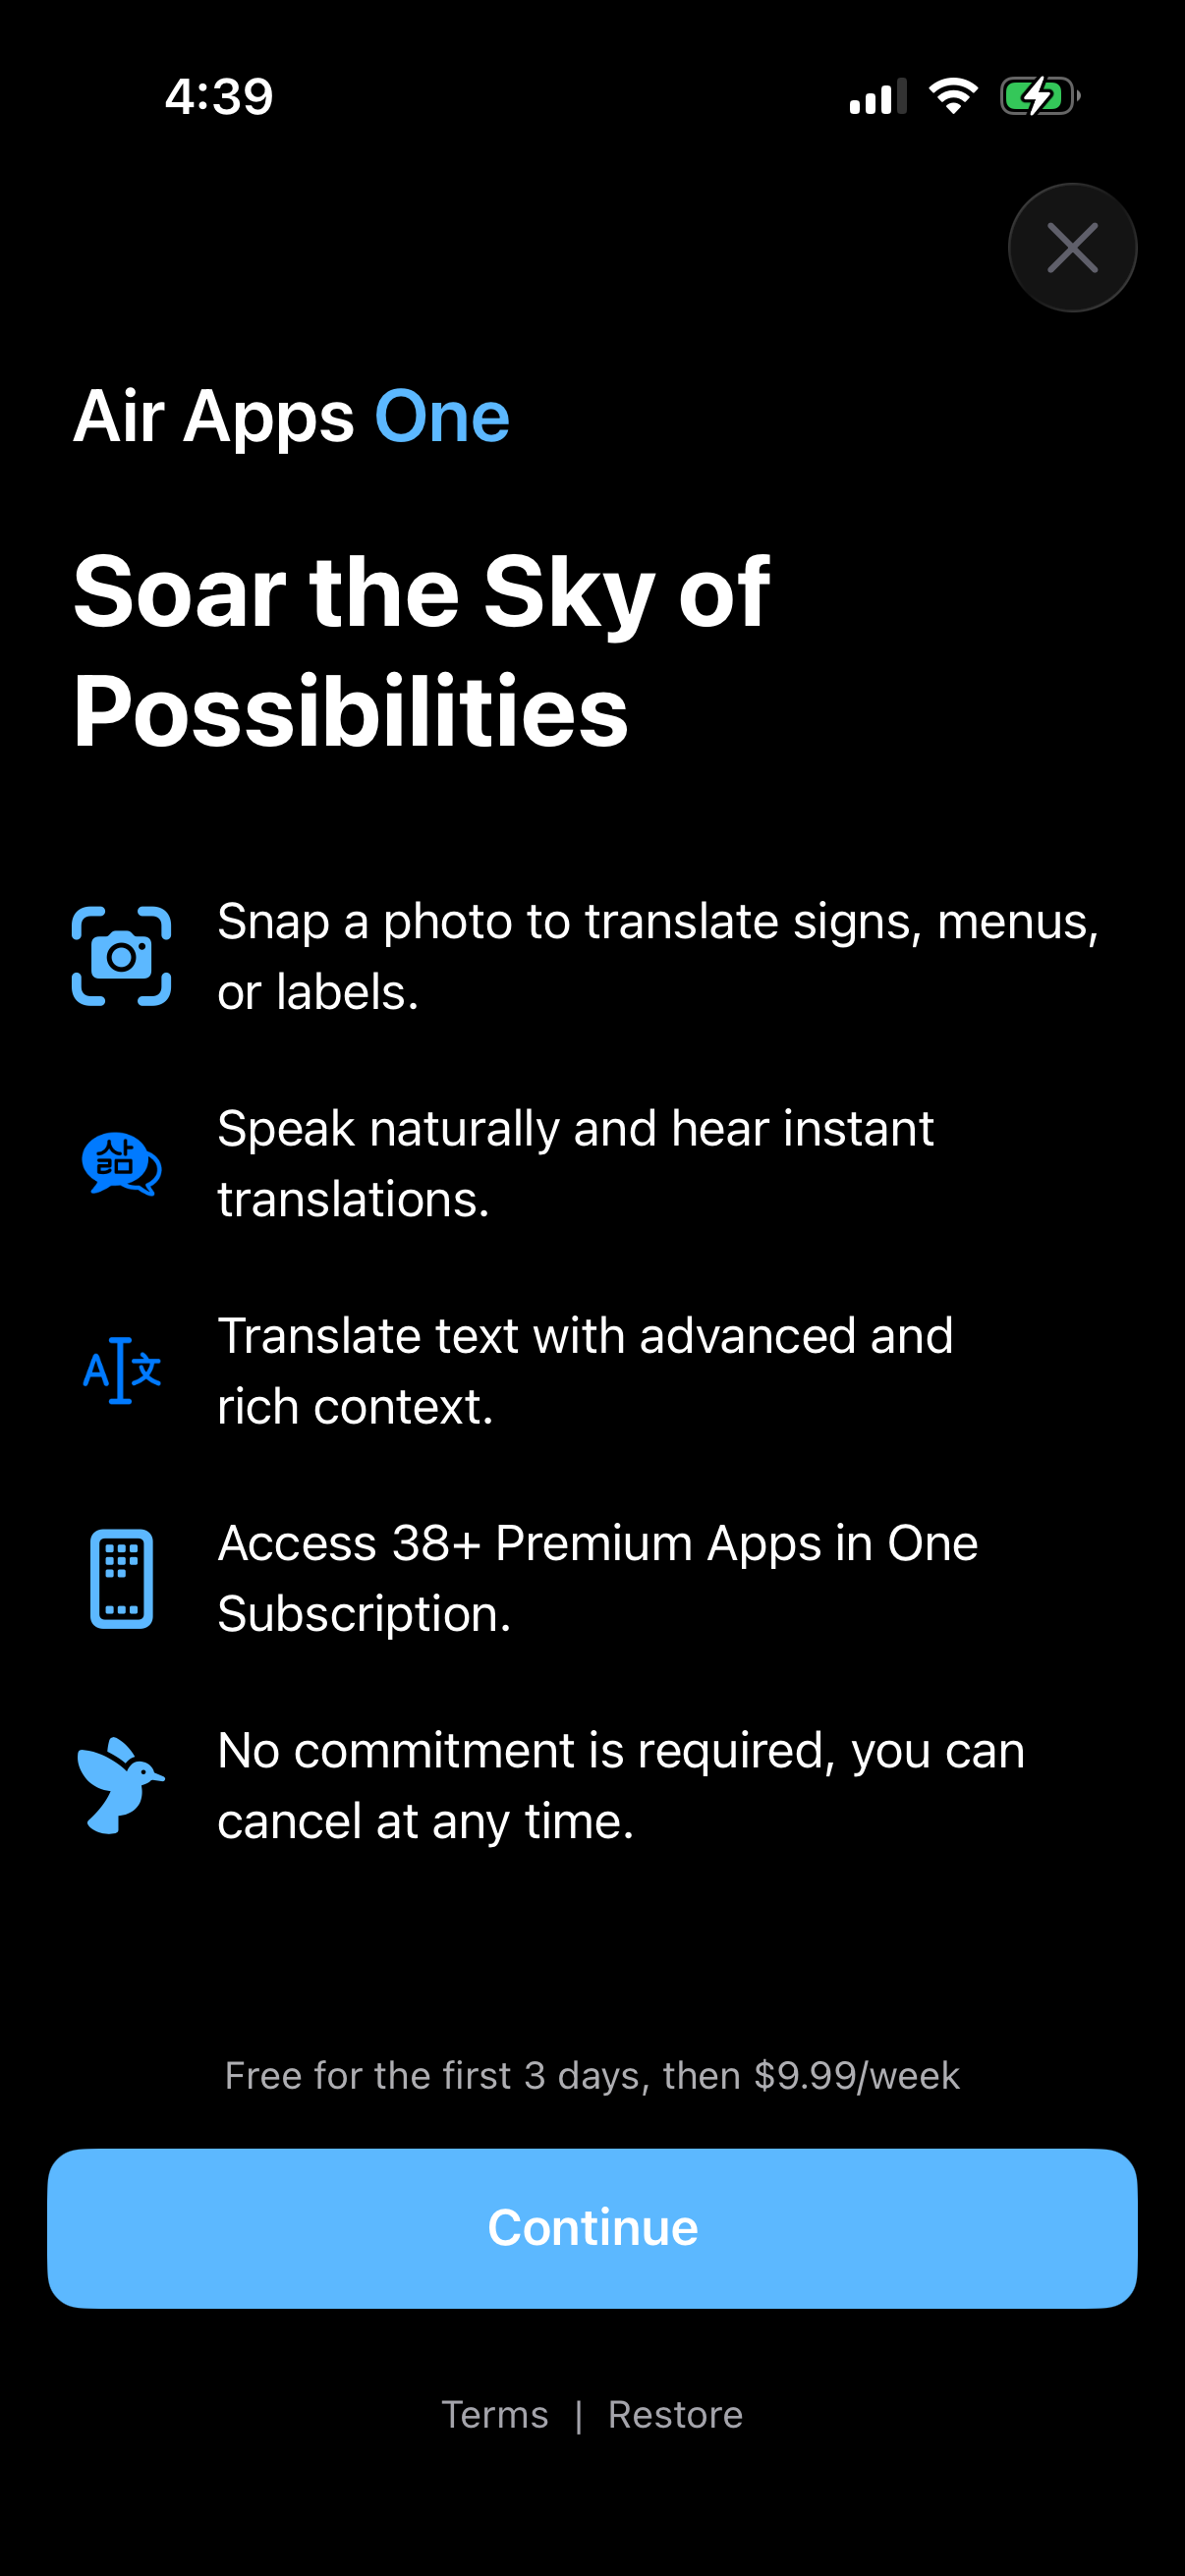
Subscription-model apps are the most upsell-heavy cohort: 56% (232/417) run an in-product upgrade banner or prompt, versus 43% of advertising-model apps (75/176) and just 15% of cross-subsidized-funnel apps (18/124).[2] Within subscription apps, unlock CTAs (32%, 133/417) and lock-icon gating (20%, 84/417) are also common, while usage gating stays niche (8%, 34/417).[2] If you sell a subscription, an in-product upgrade banner is close to table stakes.
56% of subscription-model apps (232/417) run an in-product upgrade banner — vs 15% of cross-subsidized-funnel apps — Lazyweb Research, July 2026.
| Item | Share |
|---|---|
| Subscription | 56% |
| Advertising | 43% |
| Cross-subsidized Funnel | 15% |
Finding: aggressiveness tracks the business model
Upgrade-banner prevalence by business model:[2]
| Business model | Apps | Upgrade banner | Share |
|---|---|---|---|
| Subscription | 417 | 232 | 56% |
| Advertising | 176 | 75 | 43% |
| Cross-subsidized Funnel | 124 | 18 | 15% |
Subscription apps also lead on the sharper gating mechanics:[2]
| Mechanic (Subscription, n=417) | Apps | Share |
|---|---|---|
| Upgrade banner / prompt | 232 | 56% |
| Unlock CTA | 133 | 32% |
| Lock-icon gating | 84 | 20% |
| Usage / limit gating | 34 | 8% |
How to apply
If your model is subscription, benchmark against the 56% norm: an in-product upgrade banner plus an unlock CTA on gated features is the mainstream configuration, not aggressive by category standards. Advertising apps lean lighter and usually frame the banner as 'remove ads' rather than 'unlock features' (43% run a banner).[2] Cross-subsidized-funnel apps deliberately under-upsell in-product (15%) — if that's your model, heavy in-product gating would put you well outside the norm.[2]
Caveats
Cross-subsidized-funnel cross-tabs are thin: only the upgrade-banner cell (18/124) clears the reporting threshold; unlock CTA (8), lock gating (3) and usage gating (1) for that model are raw counts, not percentages.[2] Advertising × usage gating (6 apps) is likewise a count only.[2] All shares are deduped by distinct company and are lower bounds from LLM tags.[2]
The numbers
| Stat | Computed from |
|---|---|
| 56% (232/417) | bm_subscription_upgrade_banner: 232/417 |
| 43% (75/176) | bm_advertising_upgrade_banner: 75/176 |
| 15% (18/124) | bm_cross_subsidized_upgrade_banner: 18/124 |
| 32% (133/417) | bm_subscription_unlock_cta: 133/417 |
| 20% (84/417) | bm_subscription_lock_gating: 84/417 |
| 8% (34/417) | bm_subscription_usage_gating: 34/417 |
| unlock CTA=8, lock=3, usage=1 (counts) | smallSampleWarnings: cross-subsidized funnel below-threshold counts |
| 6 apps (count only) | smallSampleWarnings: Advertising x usage gating = 6 apps |
Sources & citations
- [2] Lazyweb Research analysis of 809 apps (tracked mobile app corpus, business-model cross-tab), July 2026. Business-model attributes populated on ~800 tracked apps (Subscription=417, Advertising=176, Cross-subsidized Funnel=124 in this cross-tab); each mechanic deduped by distinct company. ↩
Source: Lazyweb Research — proprietary analysis of real, in-market app screens. Cite as Lazyweb Research, 2026-07-07.