Lock icons, blurred previews, or usage limits: how do apps gate features?
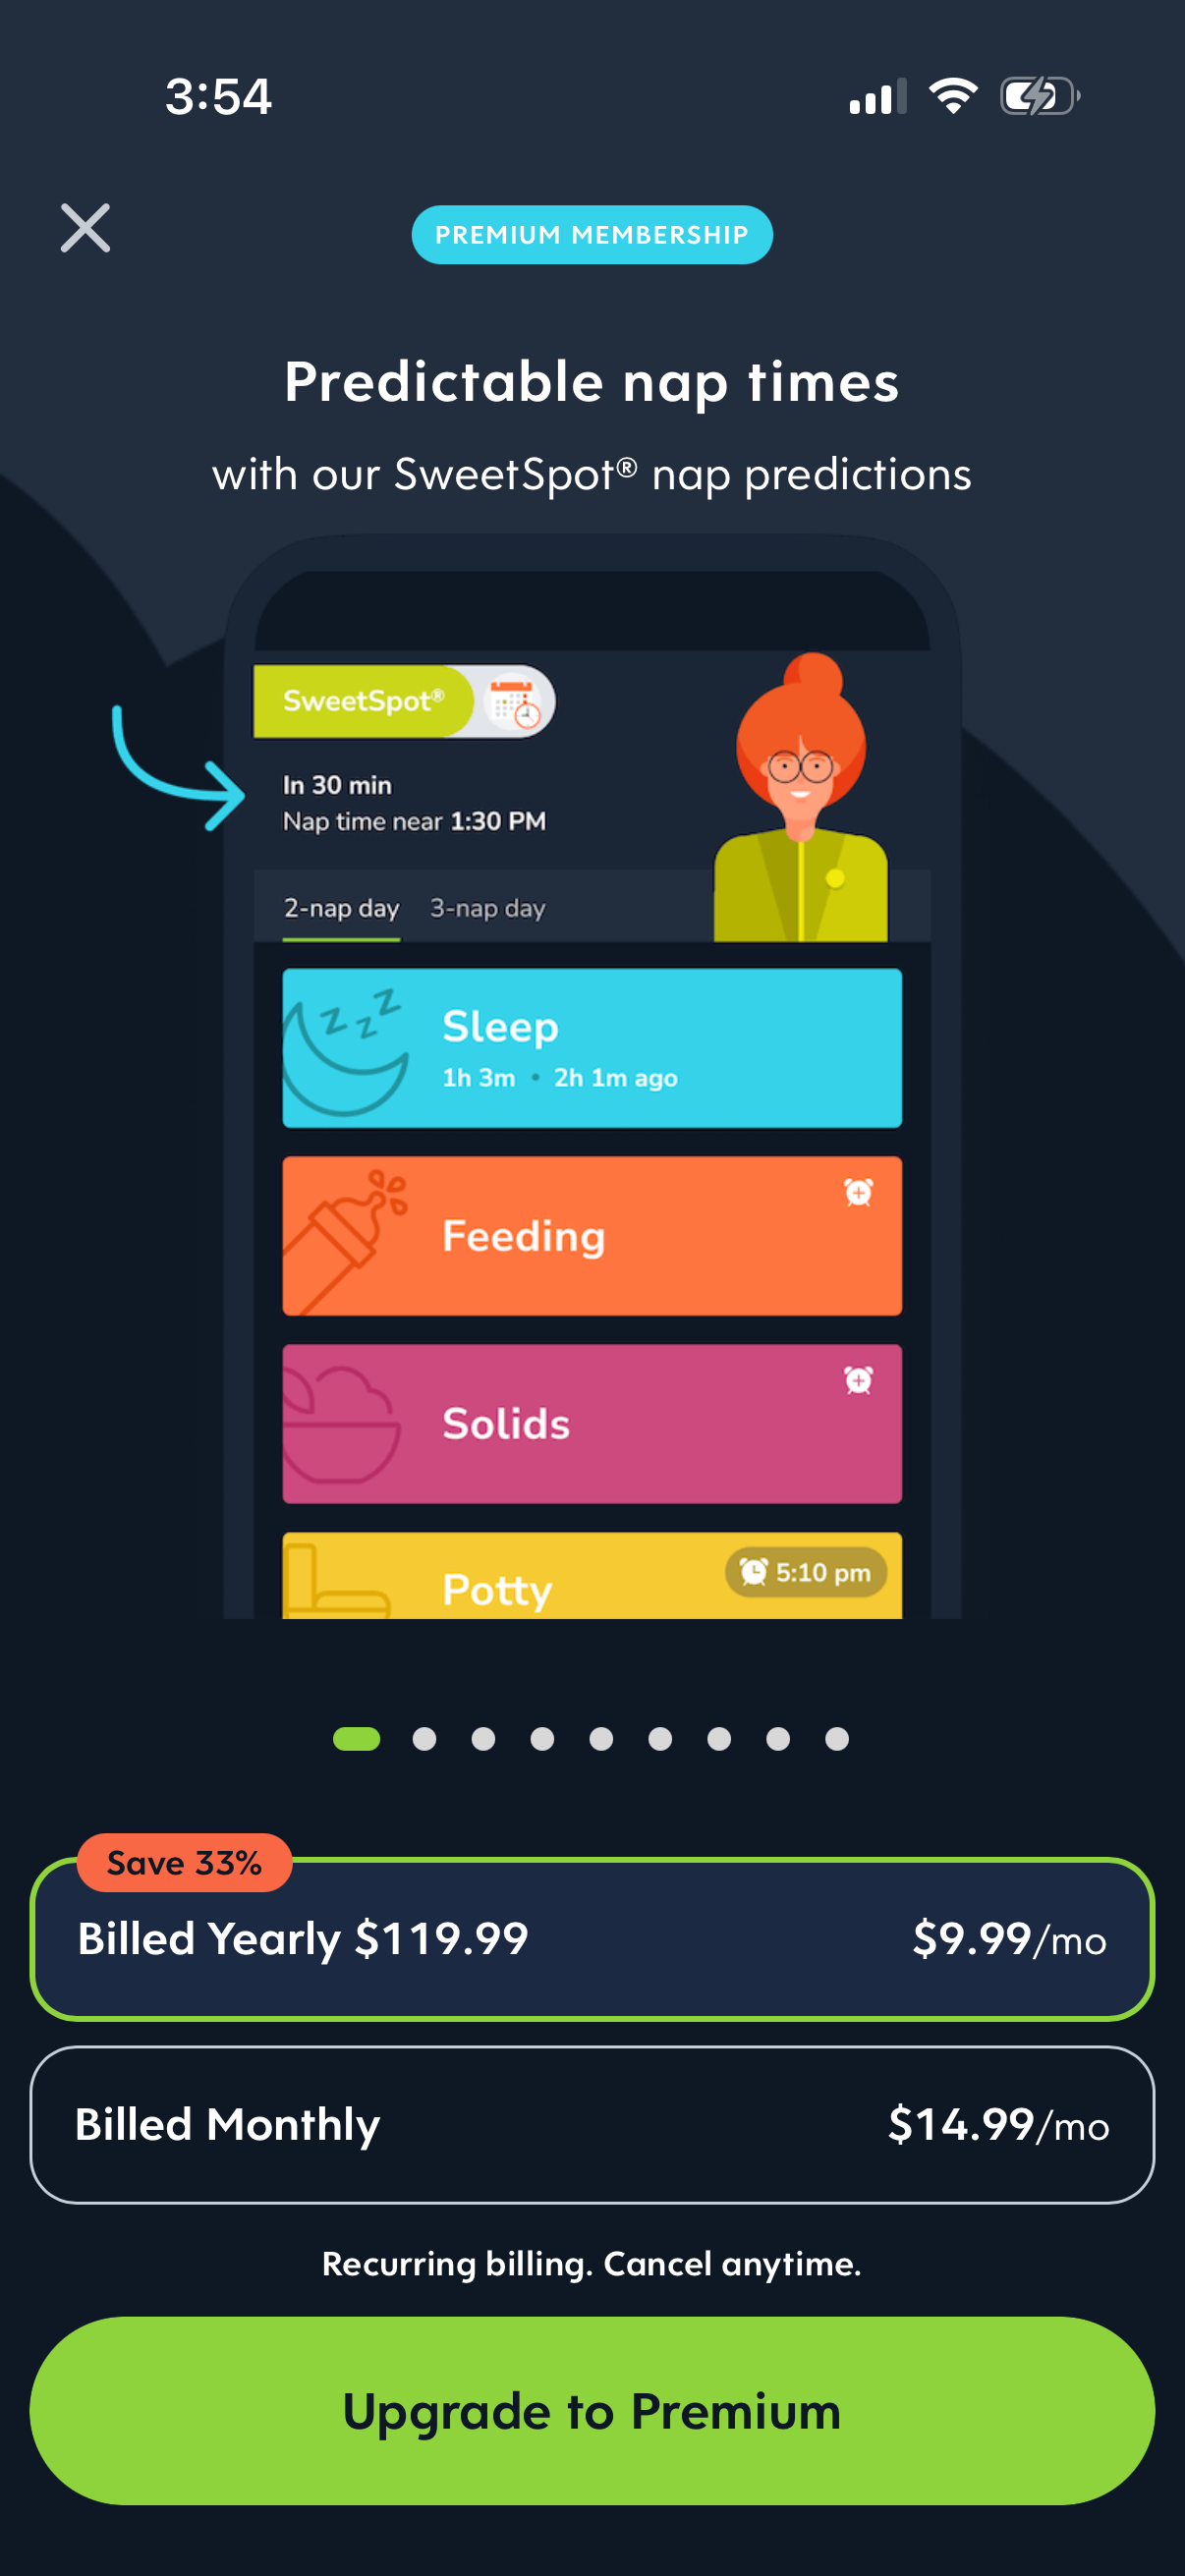
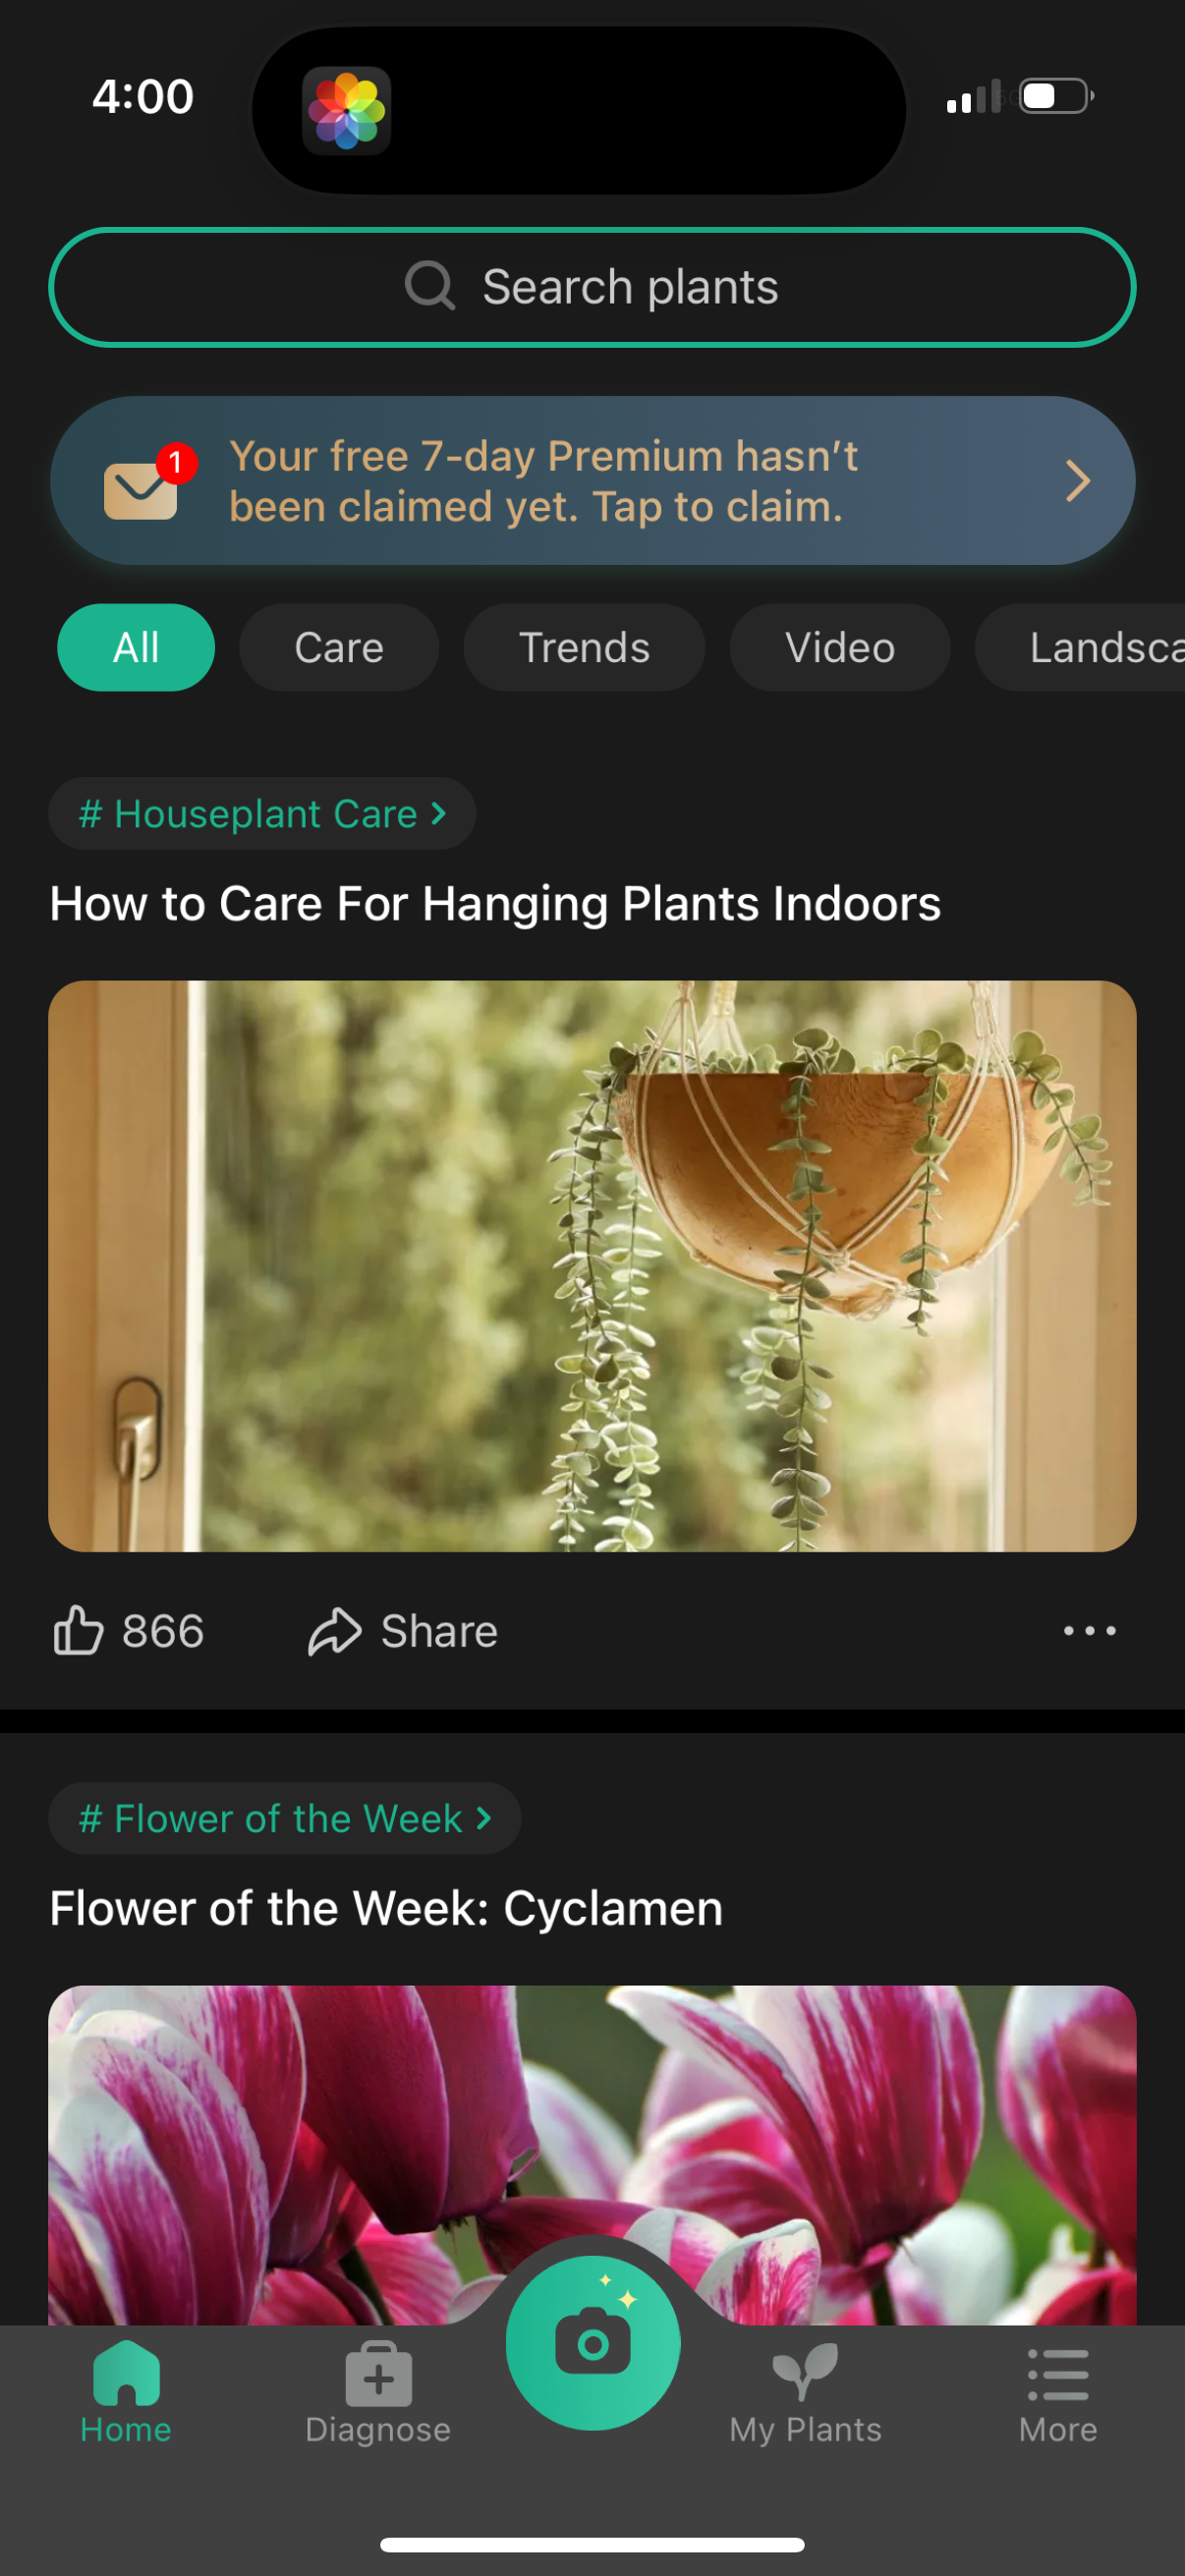
Lock-icon gating is the most common of these three, used by 12% of 809 tracked apps (94/809), versus 5% for usage-meter/limit gating (44/809).[1] Blurred-preview gating is effectively unmeasurable — a tightened pattern matched just 1 app / 3 screenshots, because raw %blur% is almost entirely loading-overlay blur, not premium teasers.[1] For gating specifically, reach for a lock icon or an unlock CTA (20%, 159/809) before a usage meter.
Lock-icon gating (12%, 94/809 apps) is over twice as common as usage-meter gating (5%, 44/809) — Lazyweb Research, July 2026.
| Item | Share |
|---|---|
| Unlock CTA | 20% |
| Lock-icon / locked content | 12% |
| Usage-meter / limit reached | 5% |
| Blurred preview | <1% |
Finding: lock and unlock dominate; usage meters are niche
Ranking the explicit gating mechanics across 809 apps:[1]
| Gating mechanic | Apps | Share | Screenshots |
|---|---|---|---|
| Unlock CTA | 159 | 20% | 658 |
| Lock-icon / locked content | 94 | 12% | 410 |
| Usage-meter / limit reached | 44 | 5% | 69 |
| Blurred preview | 1 | <1% | 3 |
Usage gating is not just rarer — it is thin: 44 apps across only 69 screenshots, so it tends to appear once per app (e.g. a single 'limit reached' state) rather than pervasively.[1]
How to apply
If the gated thing is a discrete feature or piece of content (a chapter, a filter, an export), a lock icon plus an unlock CTA is the well-trodden pattern. Reserve usage meters/limits for consumable value (credits, daily runs, quota) where a count is meaningful — but expect to build the surrounding metering, not just a banner. Do not plan a design around blurred premium previews assuming it's a common convention: the data cannot support that it is.
Caveats
Blurred-preview and usage-gating stats are explicitly flagged small-sample. Blurred previews (1 app) must not be published as a prevalence.[1] Usage gating (44 apps / 69 screenshots) is thin — pair it with named examples and avoid deep per-category cuts.[1] All figures are lower bounds from deduped LLM tags; raw %lock% (408 companies) and raw %blur% were rejected for false positives.[1]
The numbers
| Stat | Computed from |
|---|---|
| 12% (94/809), 410 screenshots | lock_icon_gating_prevalence: 94/809, 410 screenshots |
| 5% (44/809), 69 screenshots | usage_meter_limit_gating_prevalence: 44/809, 69 screenshots |
| 20% (159/809), 658 screenshots | unlock_cta_prevalence: 159/809, 658 screenshots |
| 1 app / 3 screenshots | smallSampleWarnings: blurred-preview tightened pattern = 1 company / 3 screenshots |
| 408 companies (rejected) | lock_icon_gating_prevalence sql note: raw %lock% = 408 companies, rejected |
Sources & citations
- [1] Lazyweb Research analysis of 809 apps (tracked mobile app corpus with screenshots), July 2026. Prevalence deduped by COUNT(DISTINCT company_name) over 44,873 tagged screenshots; tag patterns are LLM synonym phrases (tightened after spot-checking) so every stat is a lower bound. ↩
Source: Lazyweb Research — proprietary analysis of real, in-market app screens. Cite as Lazyweb Research, 2026-07-07.