What screen patterns are common in productivity apps?
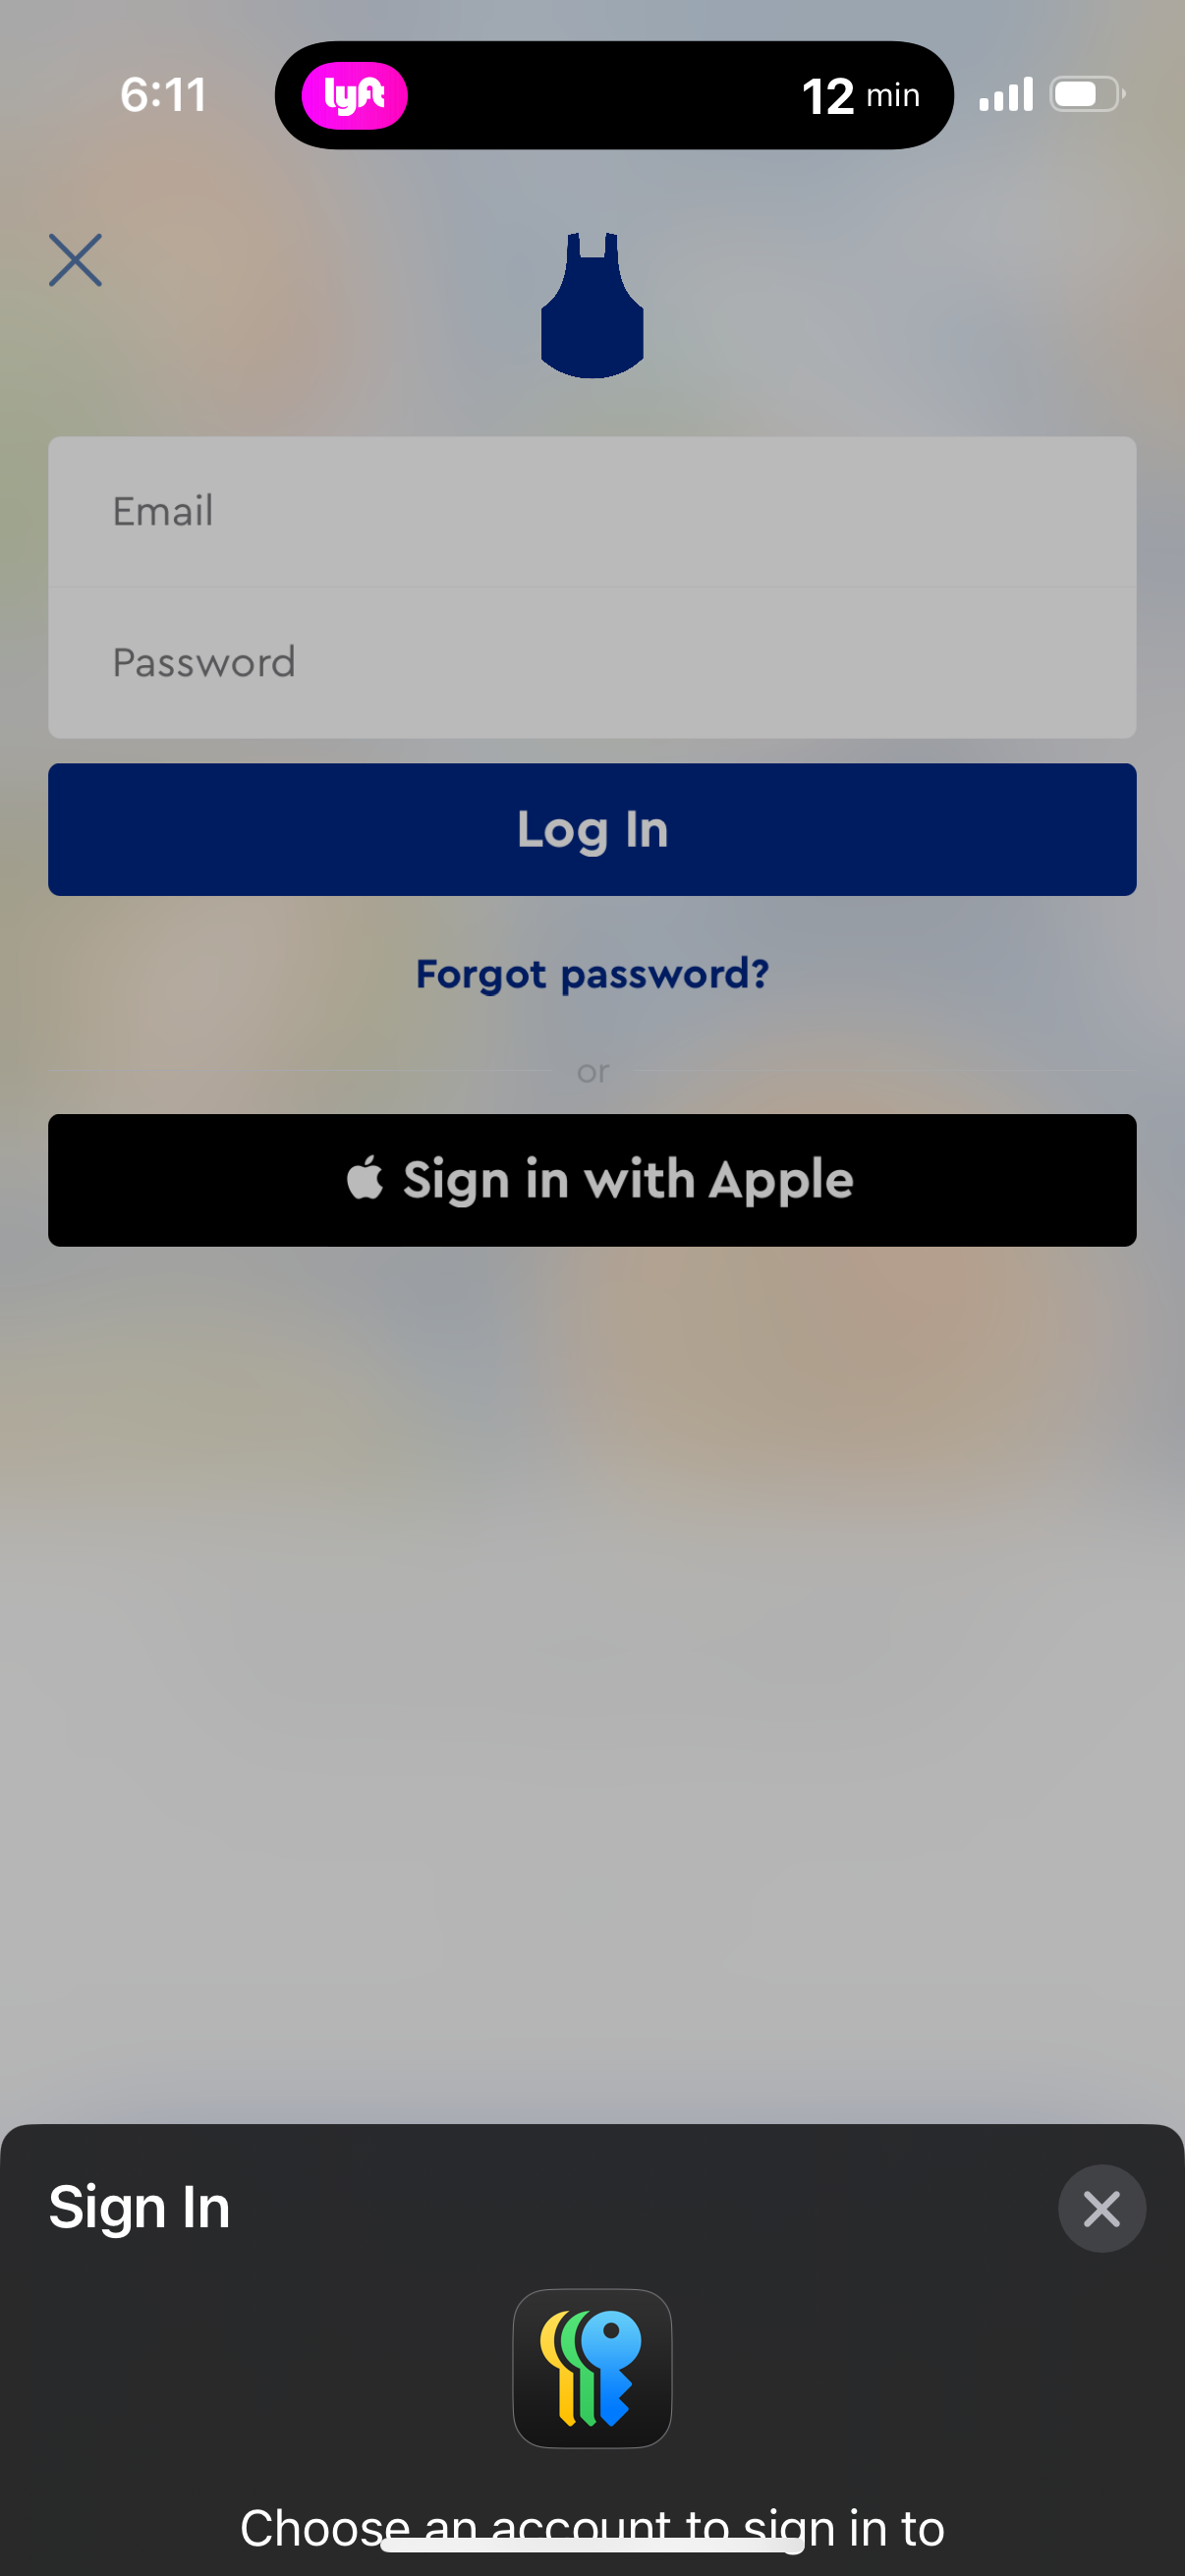
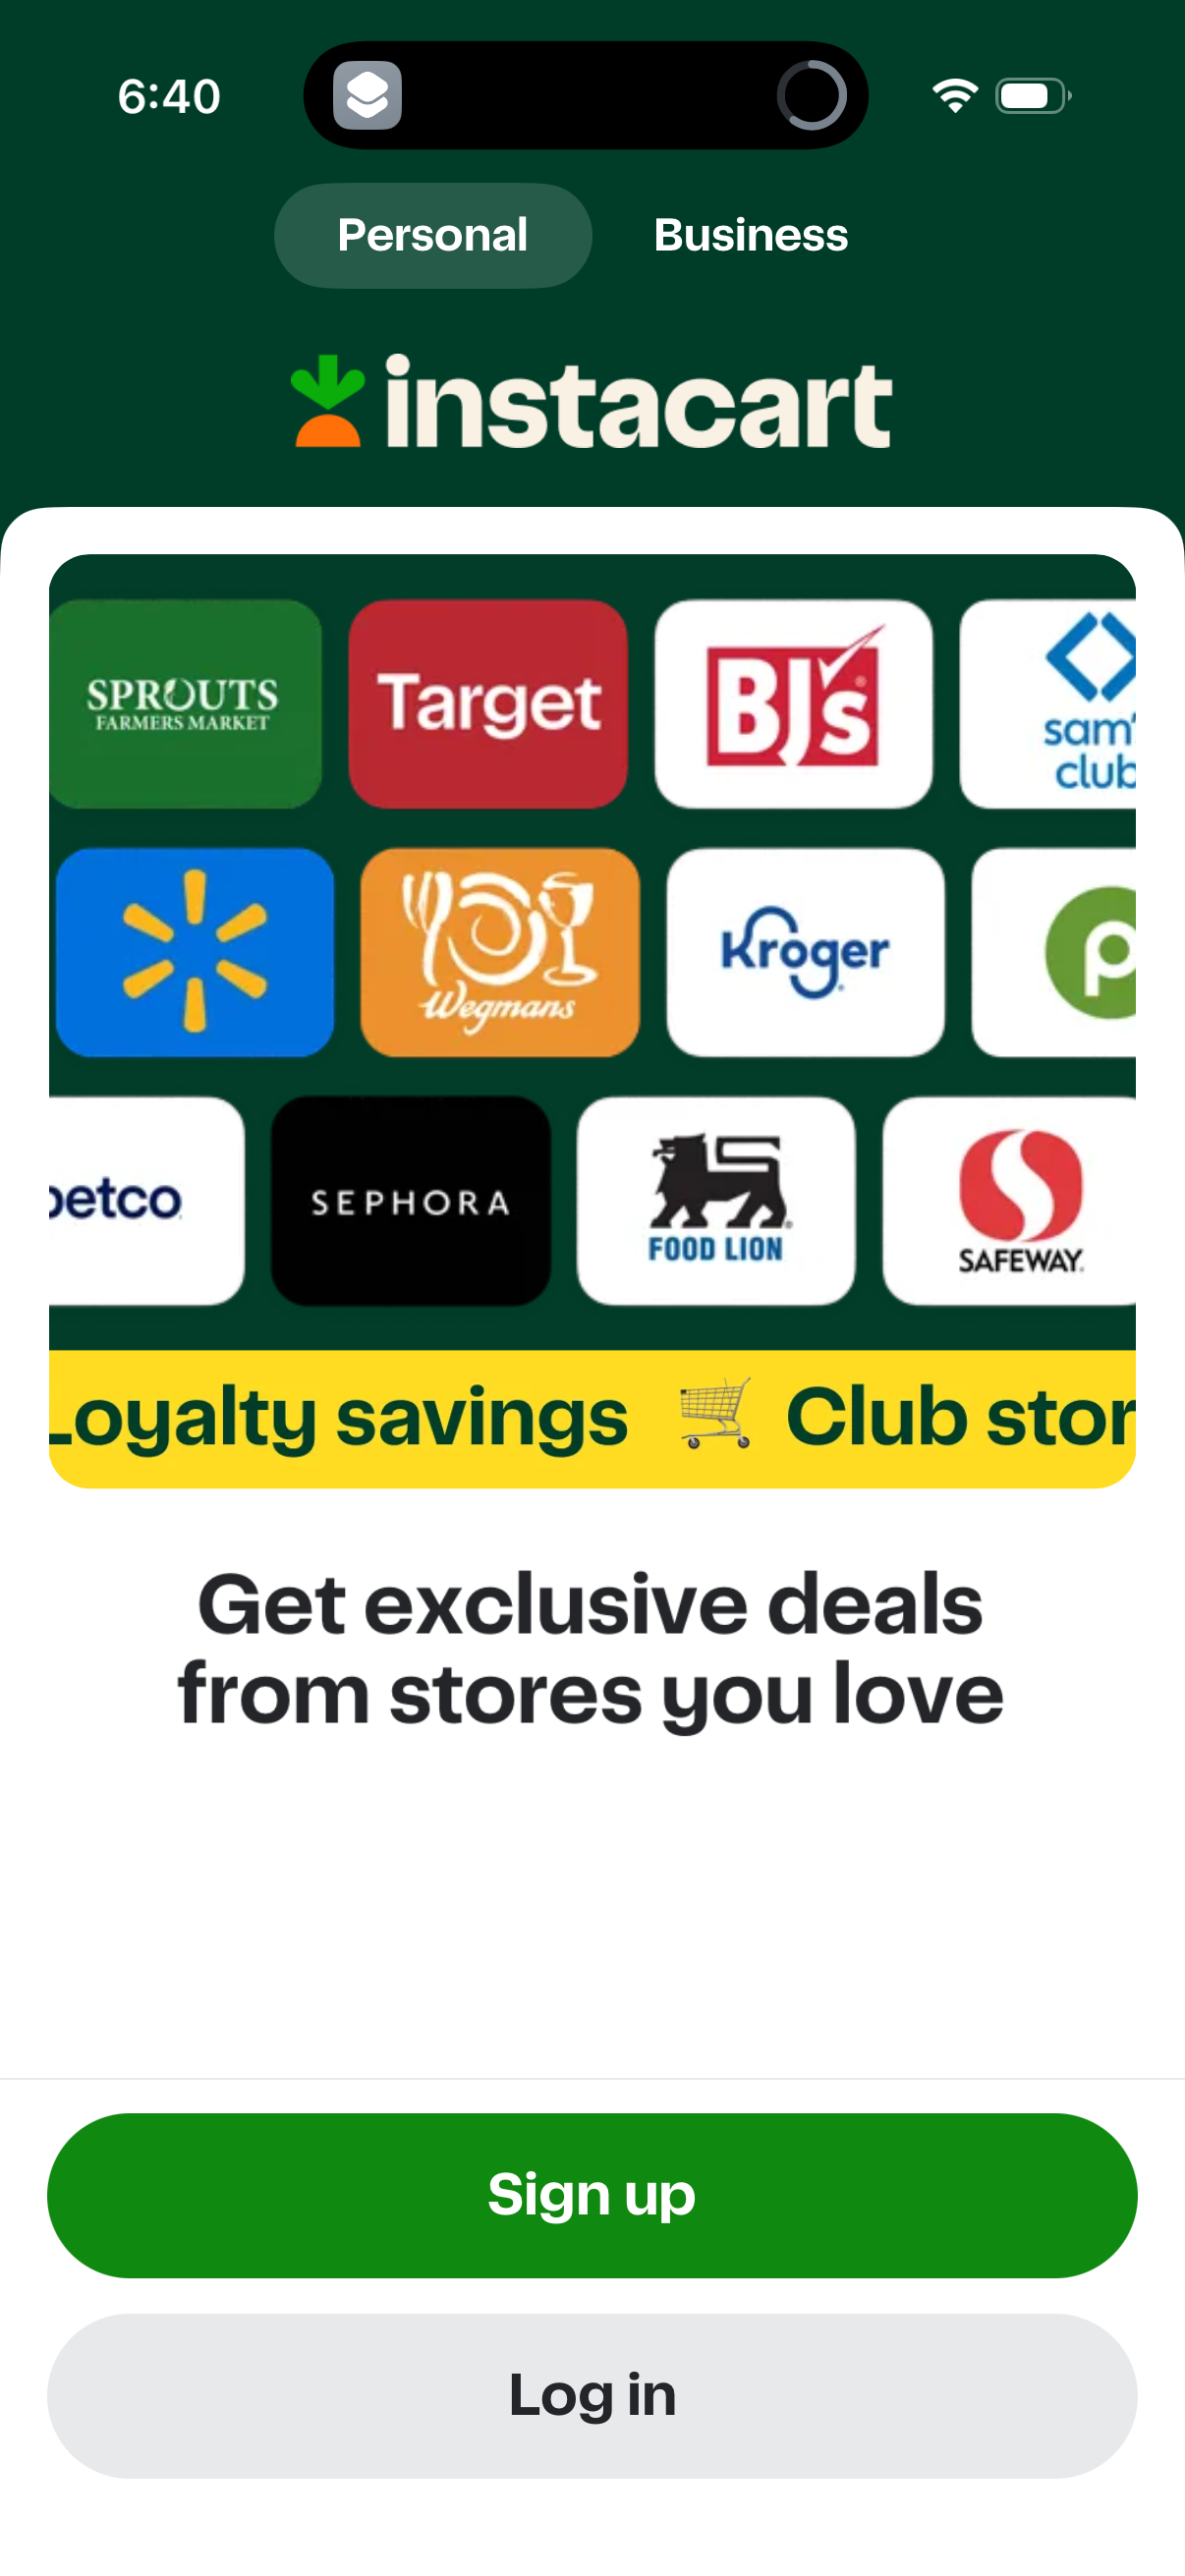
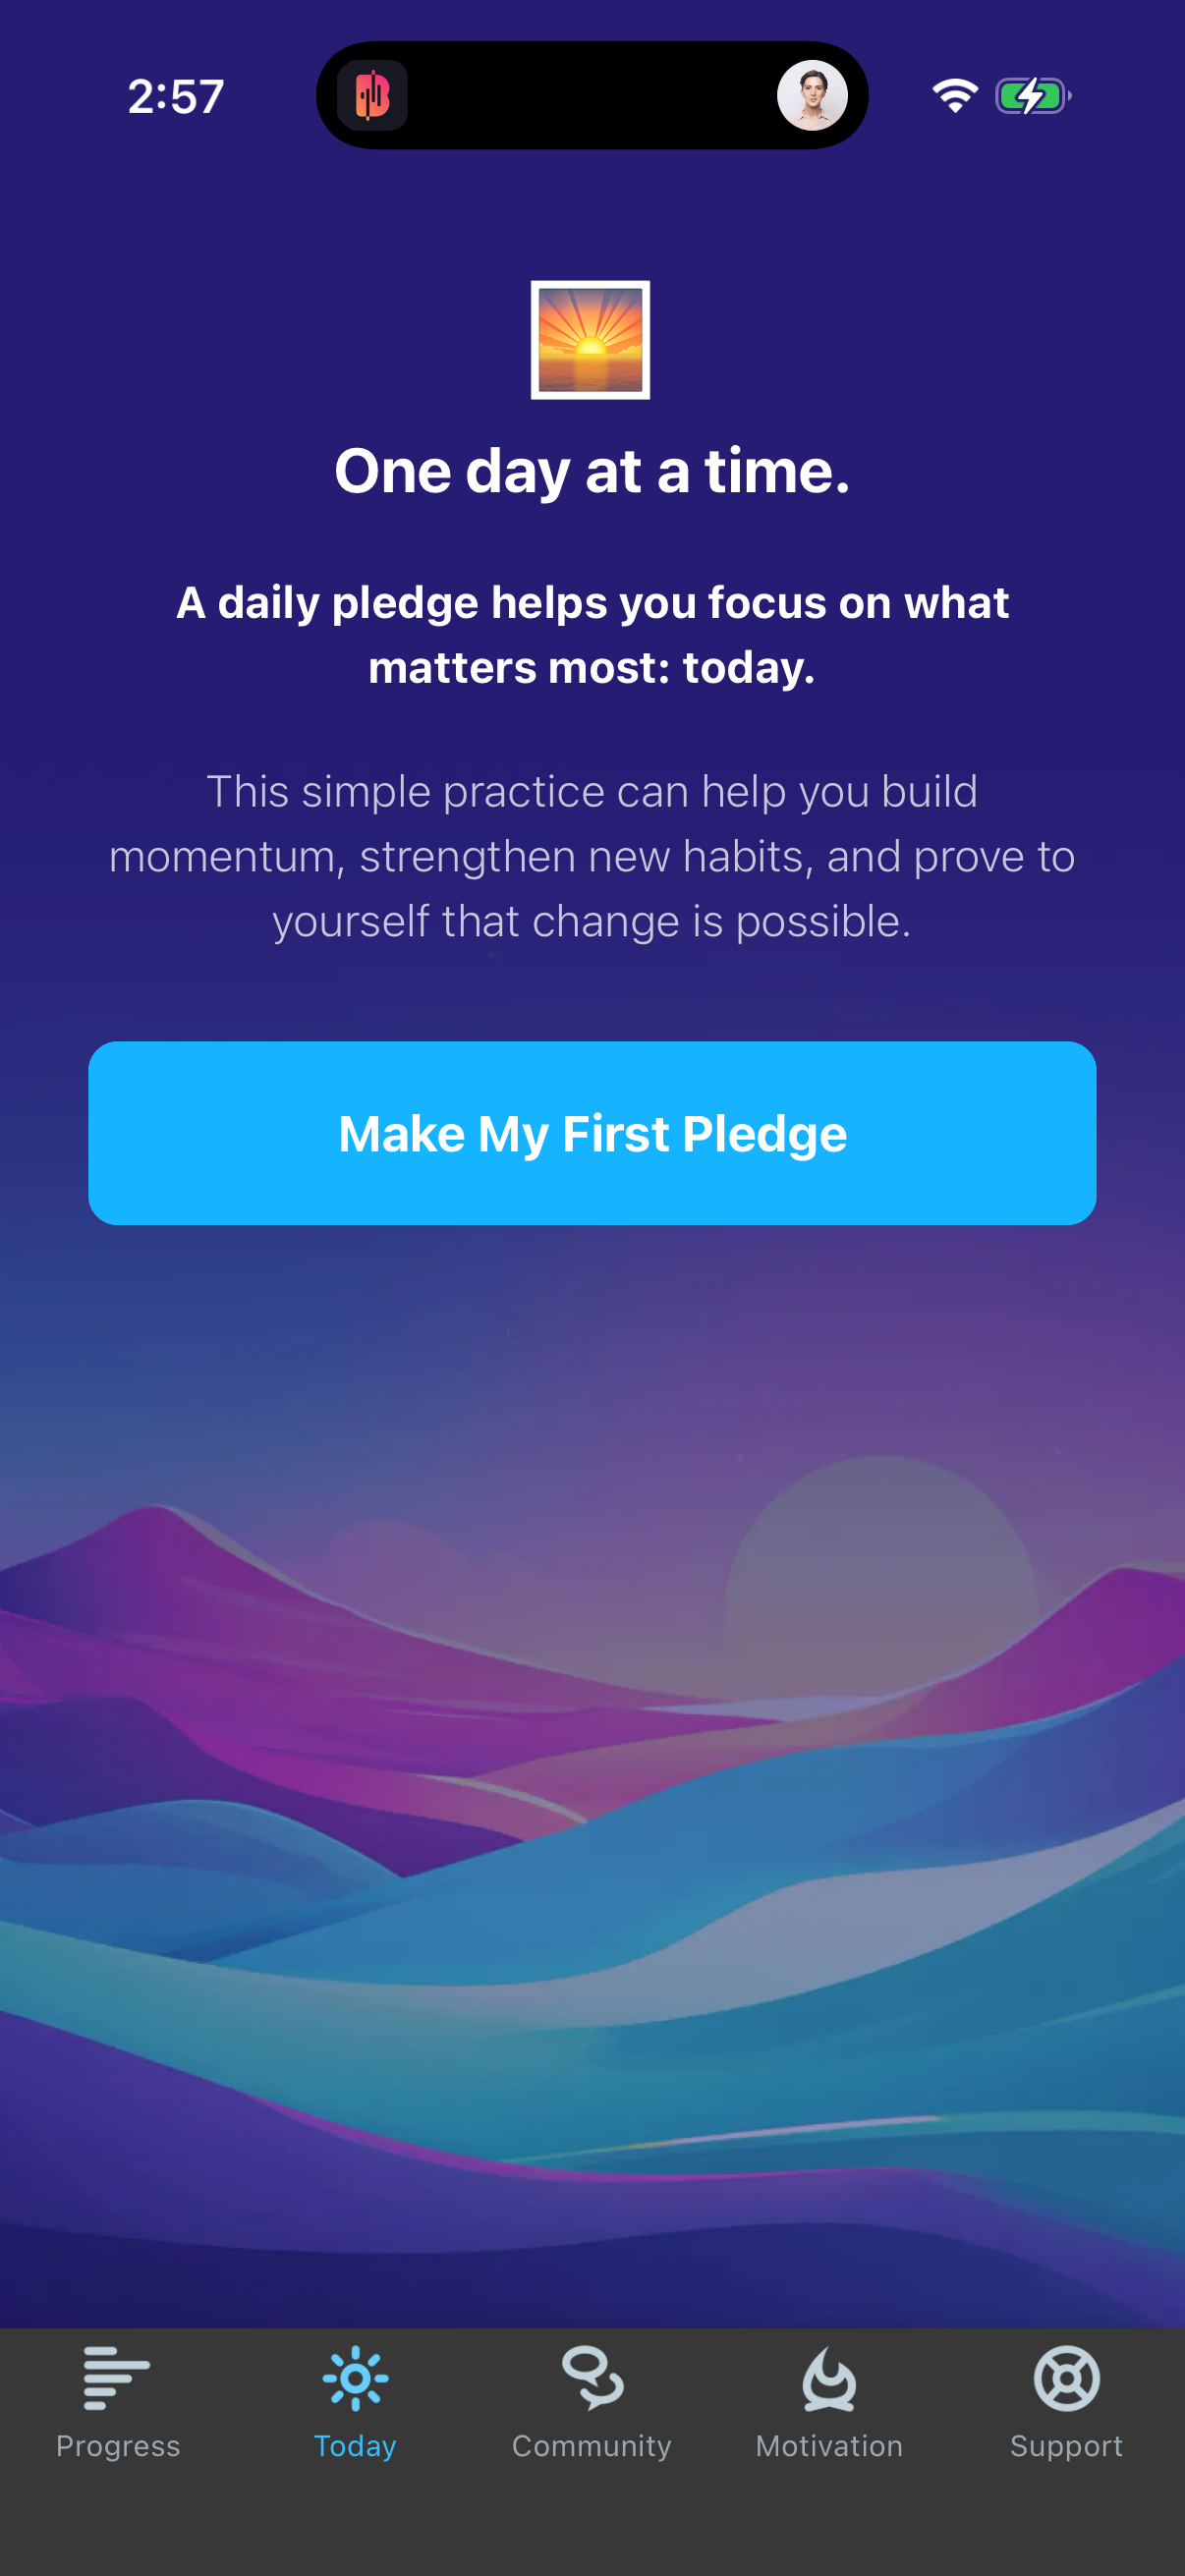
Productivity apps are middle-of-the-road on most patterns: 36% have a captured paywall (23 of 64), 39% have social login (25 of 64), and 11% have a streak (7 of 64) [1]. Referral is comparatively low at 16% (10 of 64) [2]. Nothing dominates — productivity is the vertical closest to the all-app average, with no single defining screen pattern.
23 of 64 tracked Productivity apps (36%) have a paywall; 7 of 64 (11%) have a streak — Lazyweb Research, July 2026.

| Item | Productivity |
|---|---|
| Paywall | 36% (23/64) |
| Social login | 39% (25/64) |
| Streak | 11% (7/64) |
| Referral | 16% (10/64) |
The finding
Across the largest single vertical in the census (n=64), patterns hover near the corpus average [1][2]:
| Pattern | Productivity | All apps |
|---|---|---|
| Paywall | 36% (23/64) | 37.7% |
| Social login | 39% (25/64) | 40.7% |
| Streak | 11% (7/64) | 11.6% |
| Referral | 16% (10/64) | 25.3% |
How to apply it
Productivity is the 'default settings' vertical: paywall, social login, and streak prevalence all track the all-app average almost exactly, so the global benchmarks in this census apply cleanly here [1]. The one place productivity lags is referral (16% vs 25% overall) — likely because individual-tool word-of-mouth is weaker than in social or fitness apps. If growth is the goal, an explicit referral surface would put you above your vertical's norm.
Caveats
Productivity has the largest vertical sample (n=64), so these rates are among the most reliable in the census [1]. Streak (7 apps) and referral (10 apps) numerators are still modest — publish absolute counts alongside percentages. Deduped by company; lower bound on capture.
The numbers
| Stat | Computed from |
|---|---|
| Productivity: paywall 36% (23/64), social login 39% (25/64), streak 11% (7/64) | paywall_by_category['Productivity']; social_login_by_category['Productivity']; streaks_by_category['Productivity'] |
| Productivity referral 16% (10/64) vs 25.3% all apps | referral_by_category['Productivity']: 10/64; prevalence_referral_invite |
Sources & citations
- [1] Lazyweb Research analysis of 809 mobile apps (809 mobile apps with >=1 captured screen; 751 with tag data; median 41 screens/app), July 2026. Prevalence = COUNT(DISTINCT company_name) over LLM synonym tags; denominator is 809 tracked apps (reported conservatively over all apps-with-screens, not the 62,376-row companies table). Lower bound: only reflects screens Lazyweb captured (median 41/app). ↩
Source: Lazyweb Research — proprietary analysis of real, in-market app screens. Cite as Lazyweb Research, 2026-07-07.
Explore the evidence
Related questions
More in Mobile screen-pattern prevalence censuses (does everyone have X screen?) →