What is the prevalence benchmark for each in-product upsell mechanic?
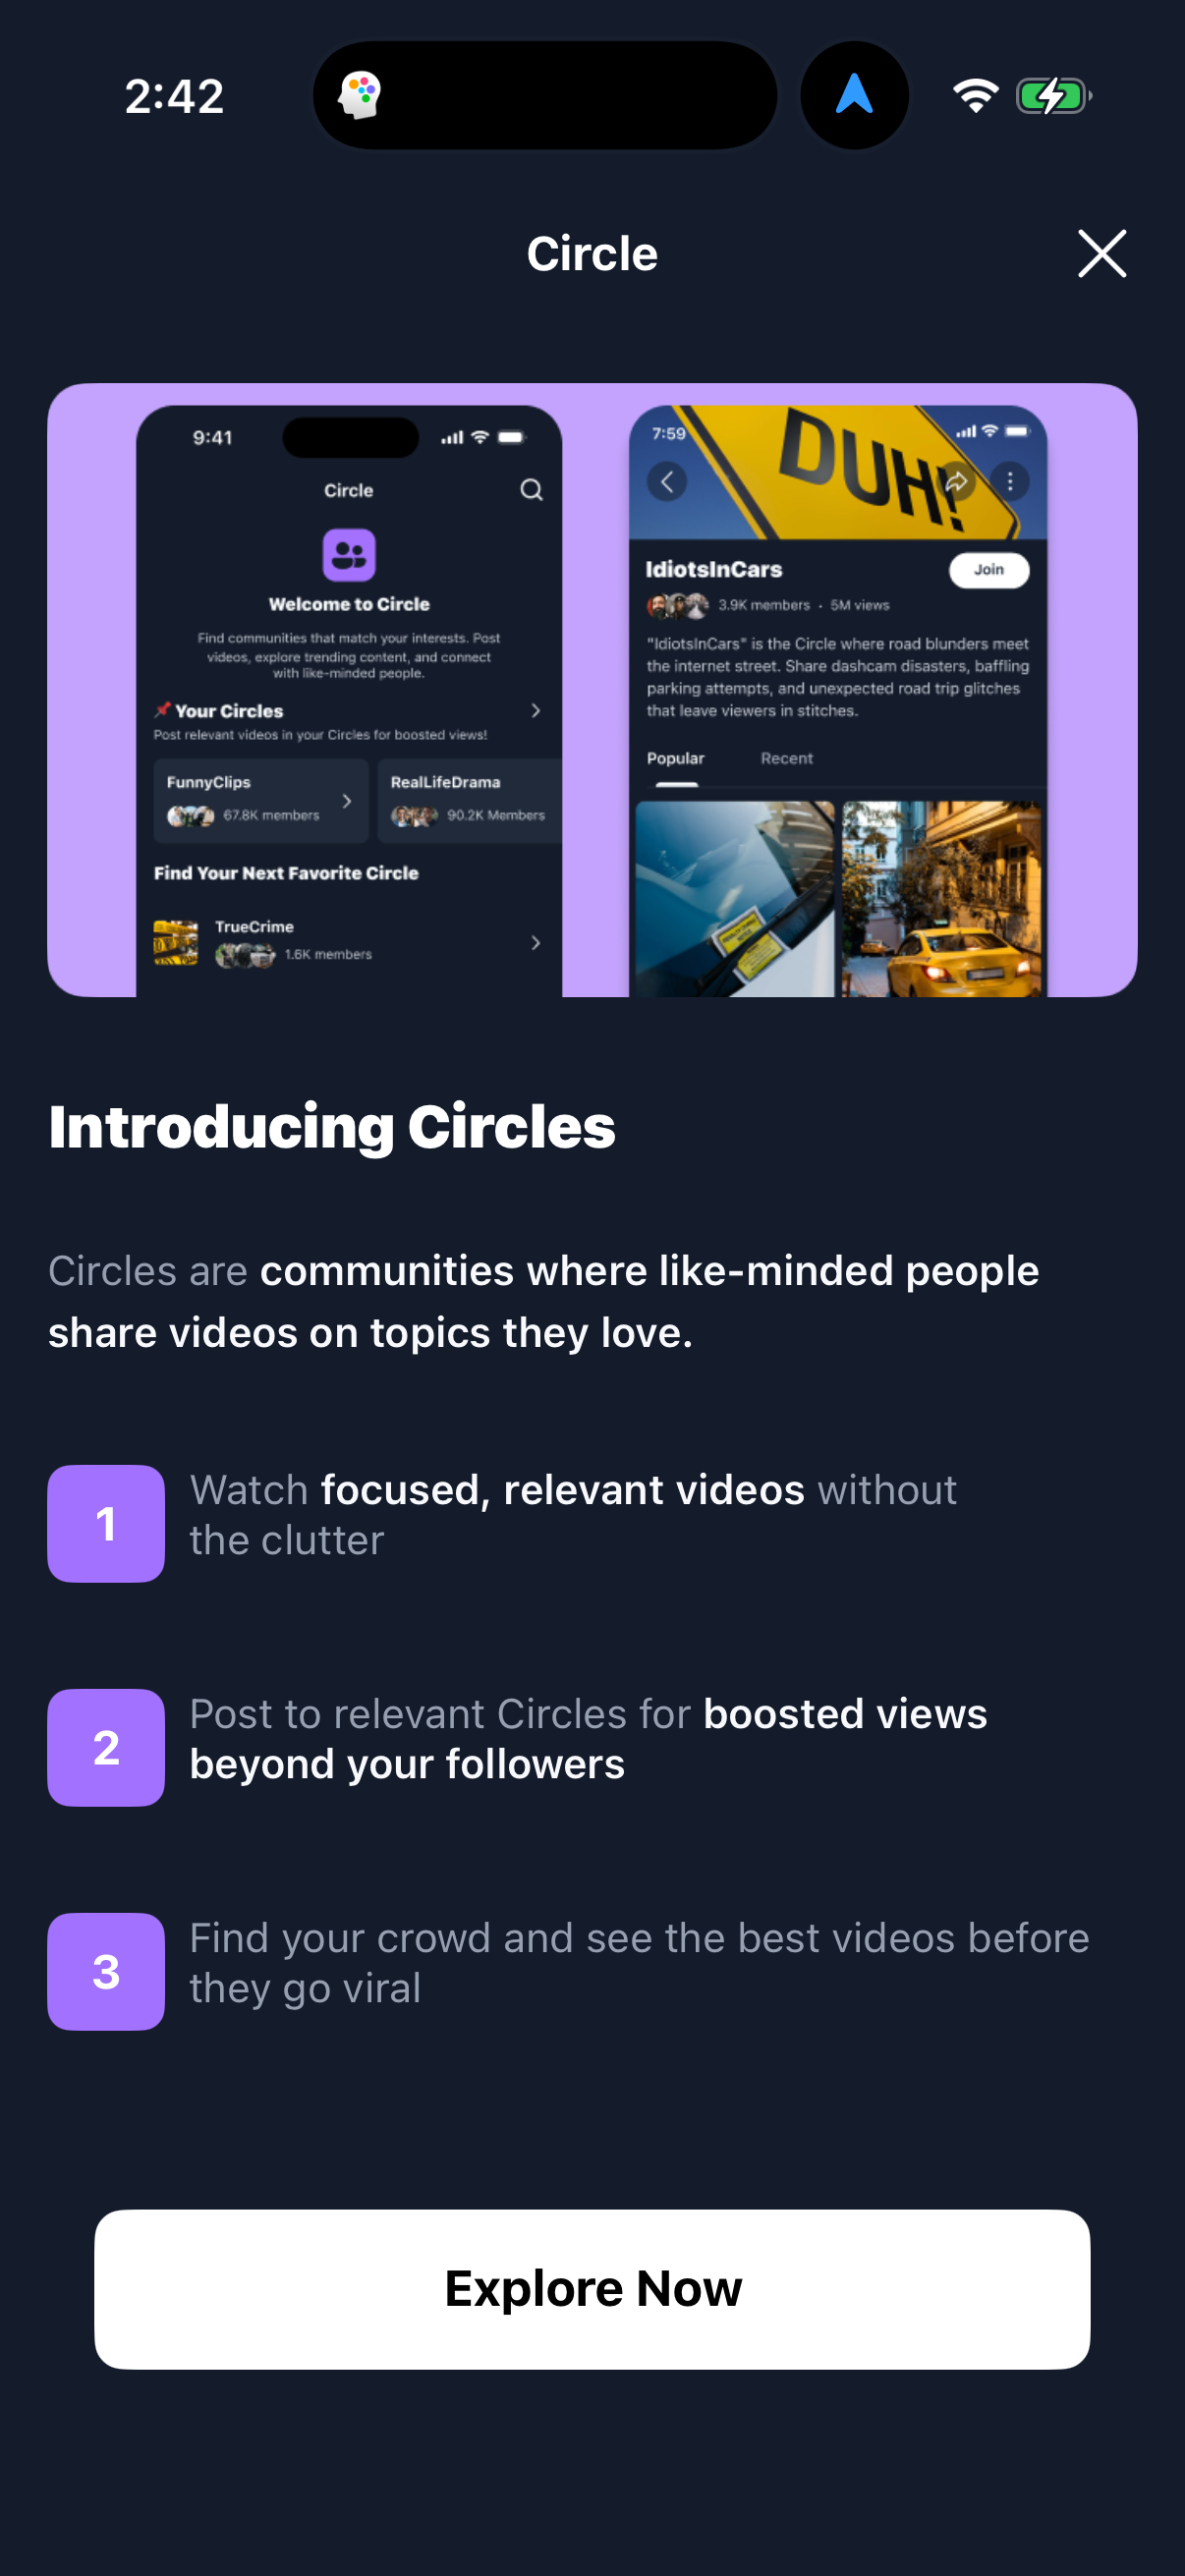
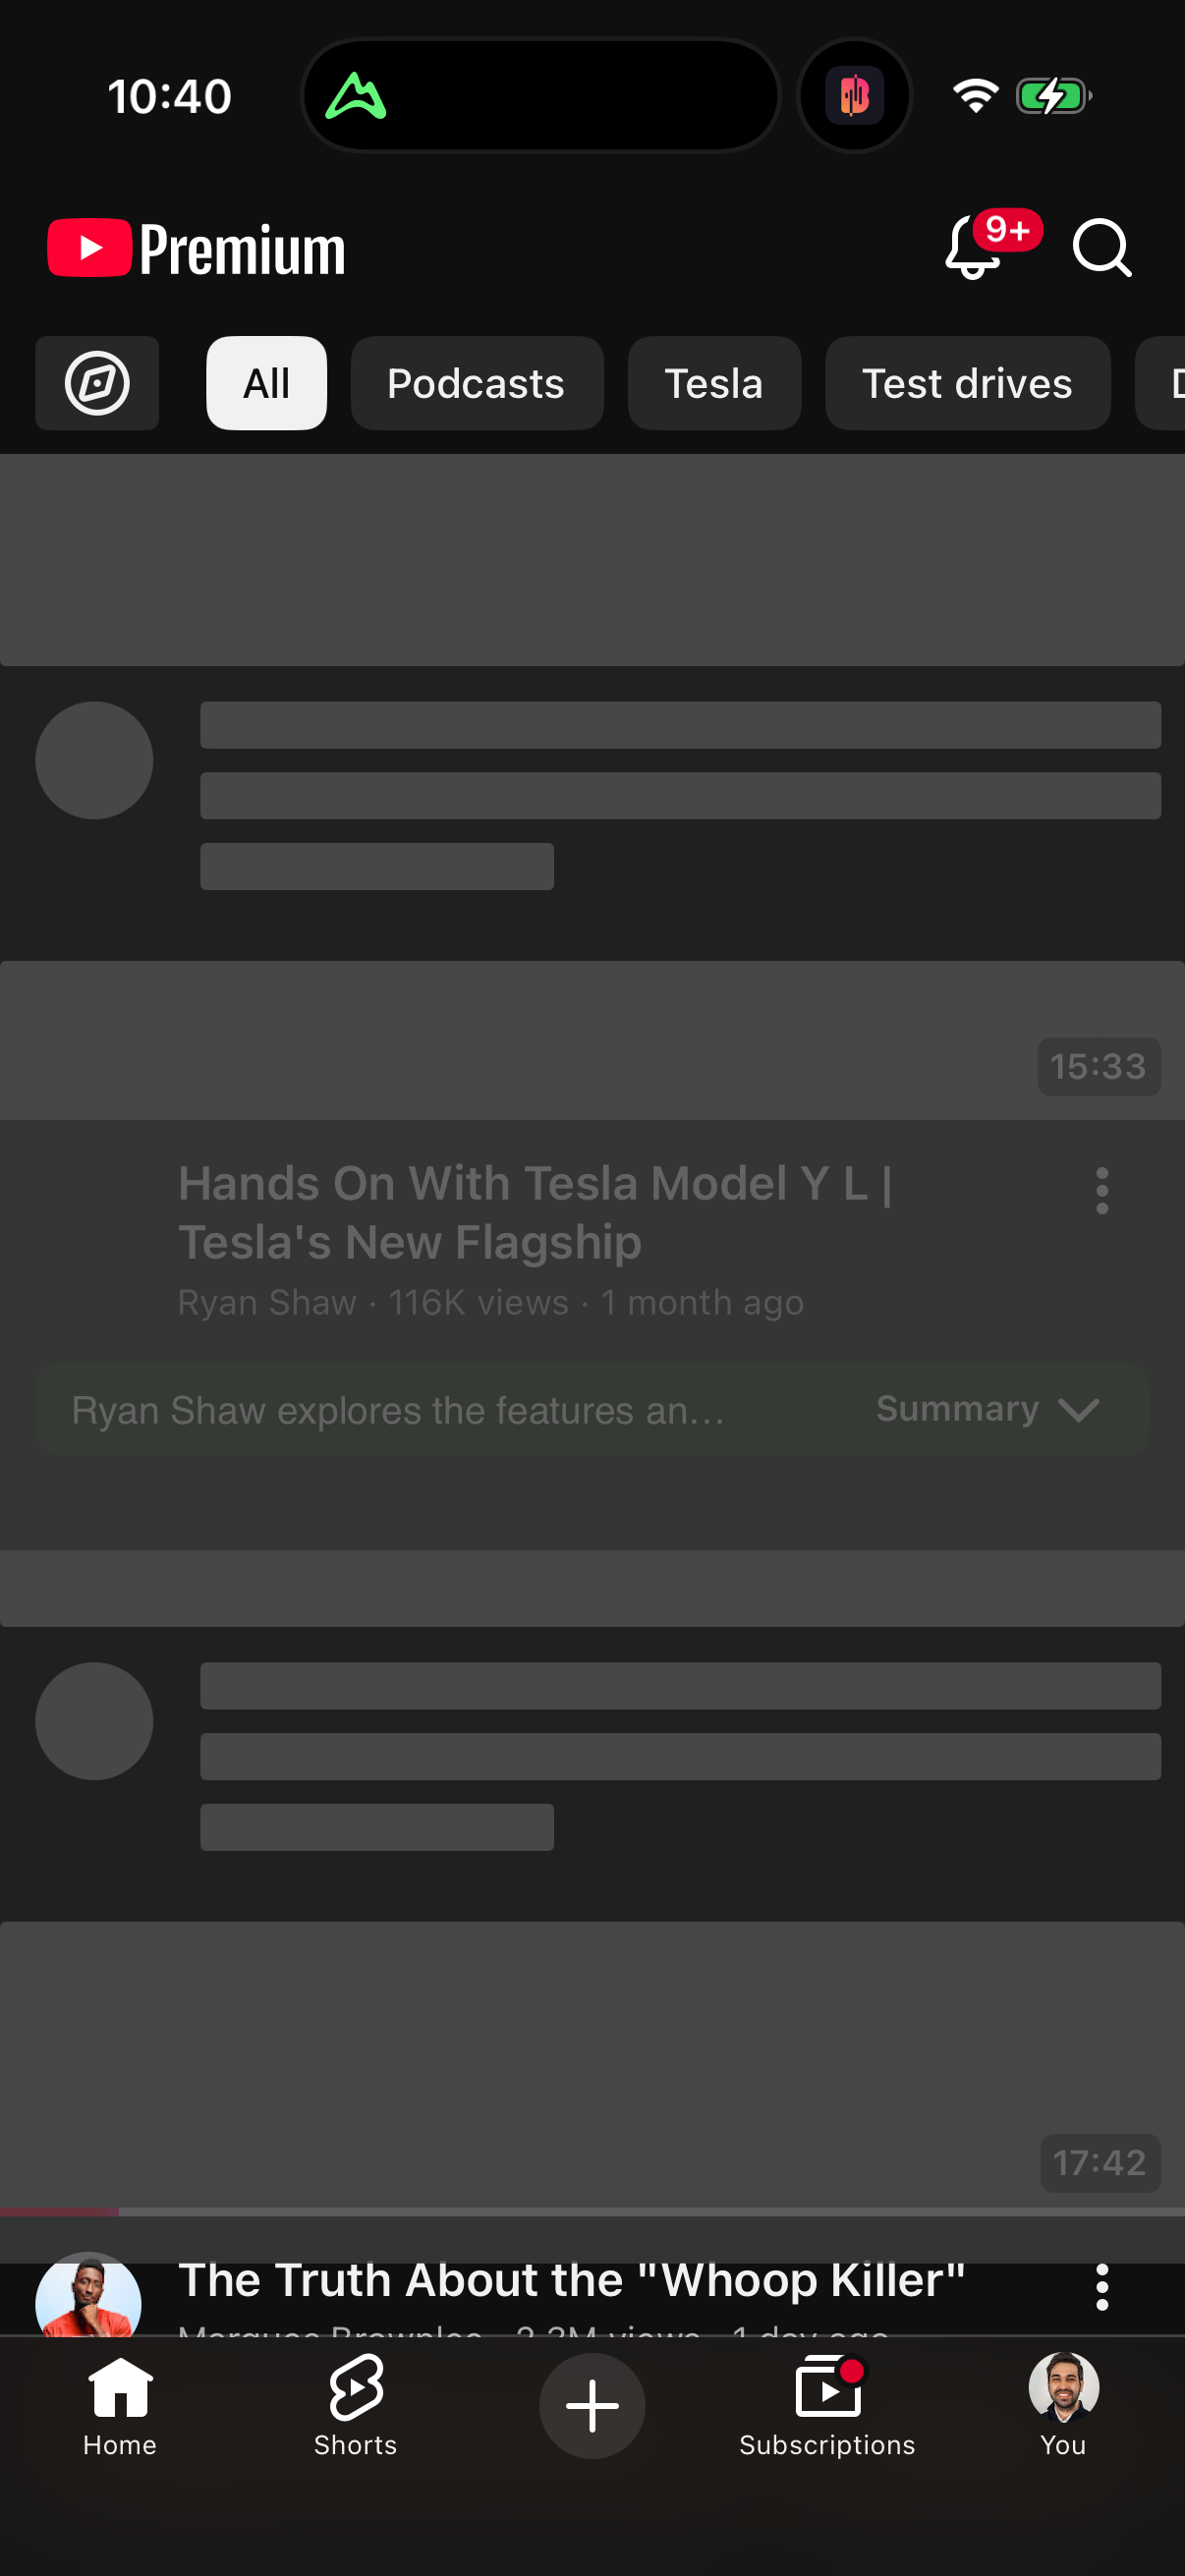
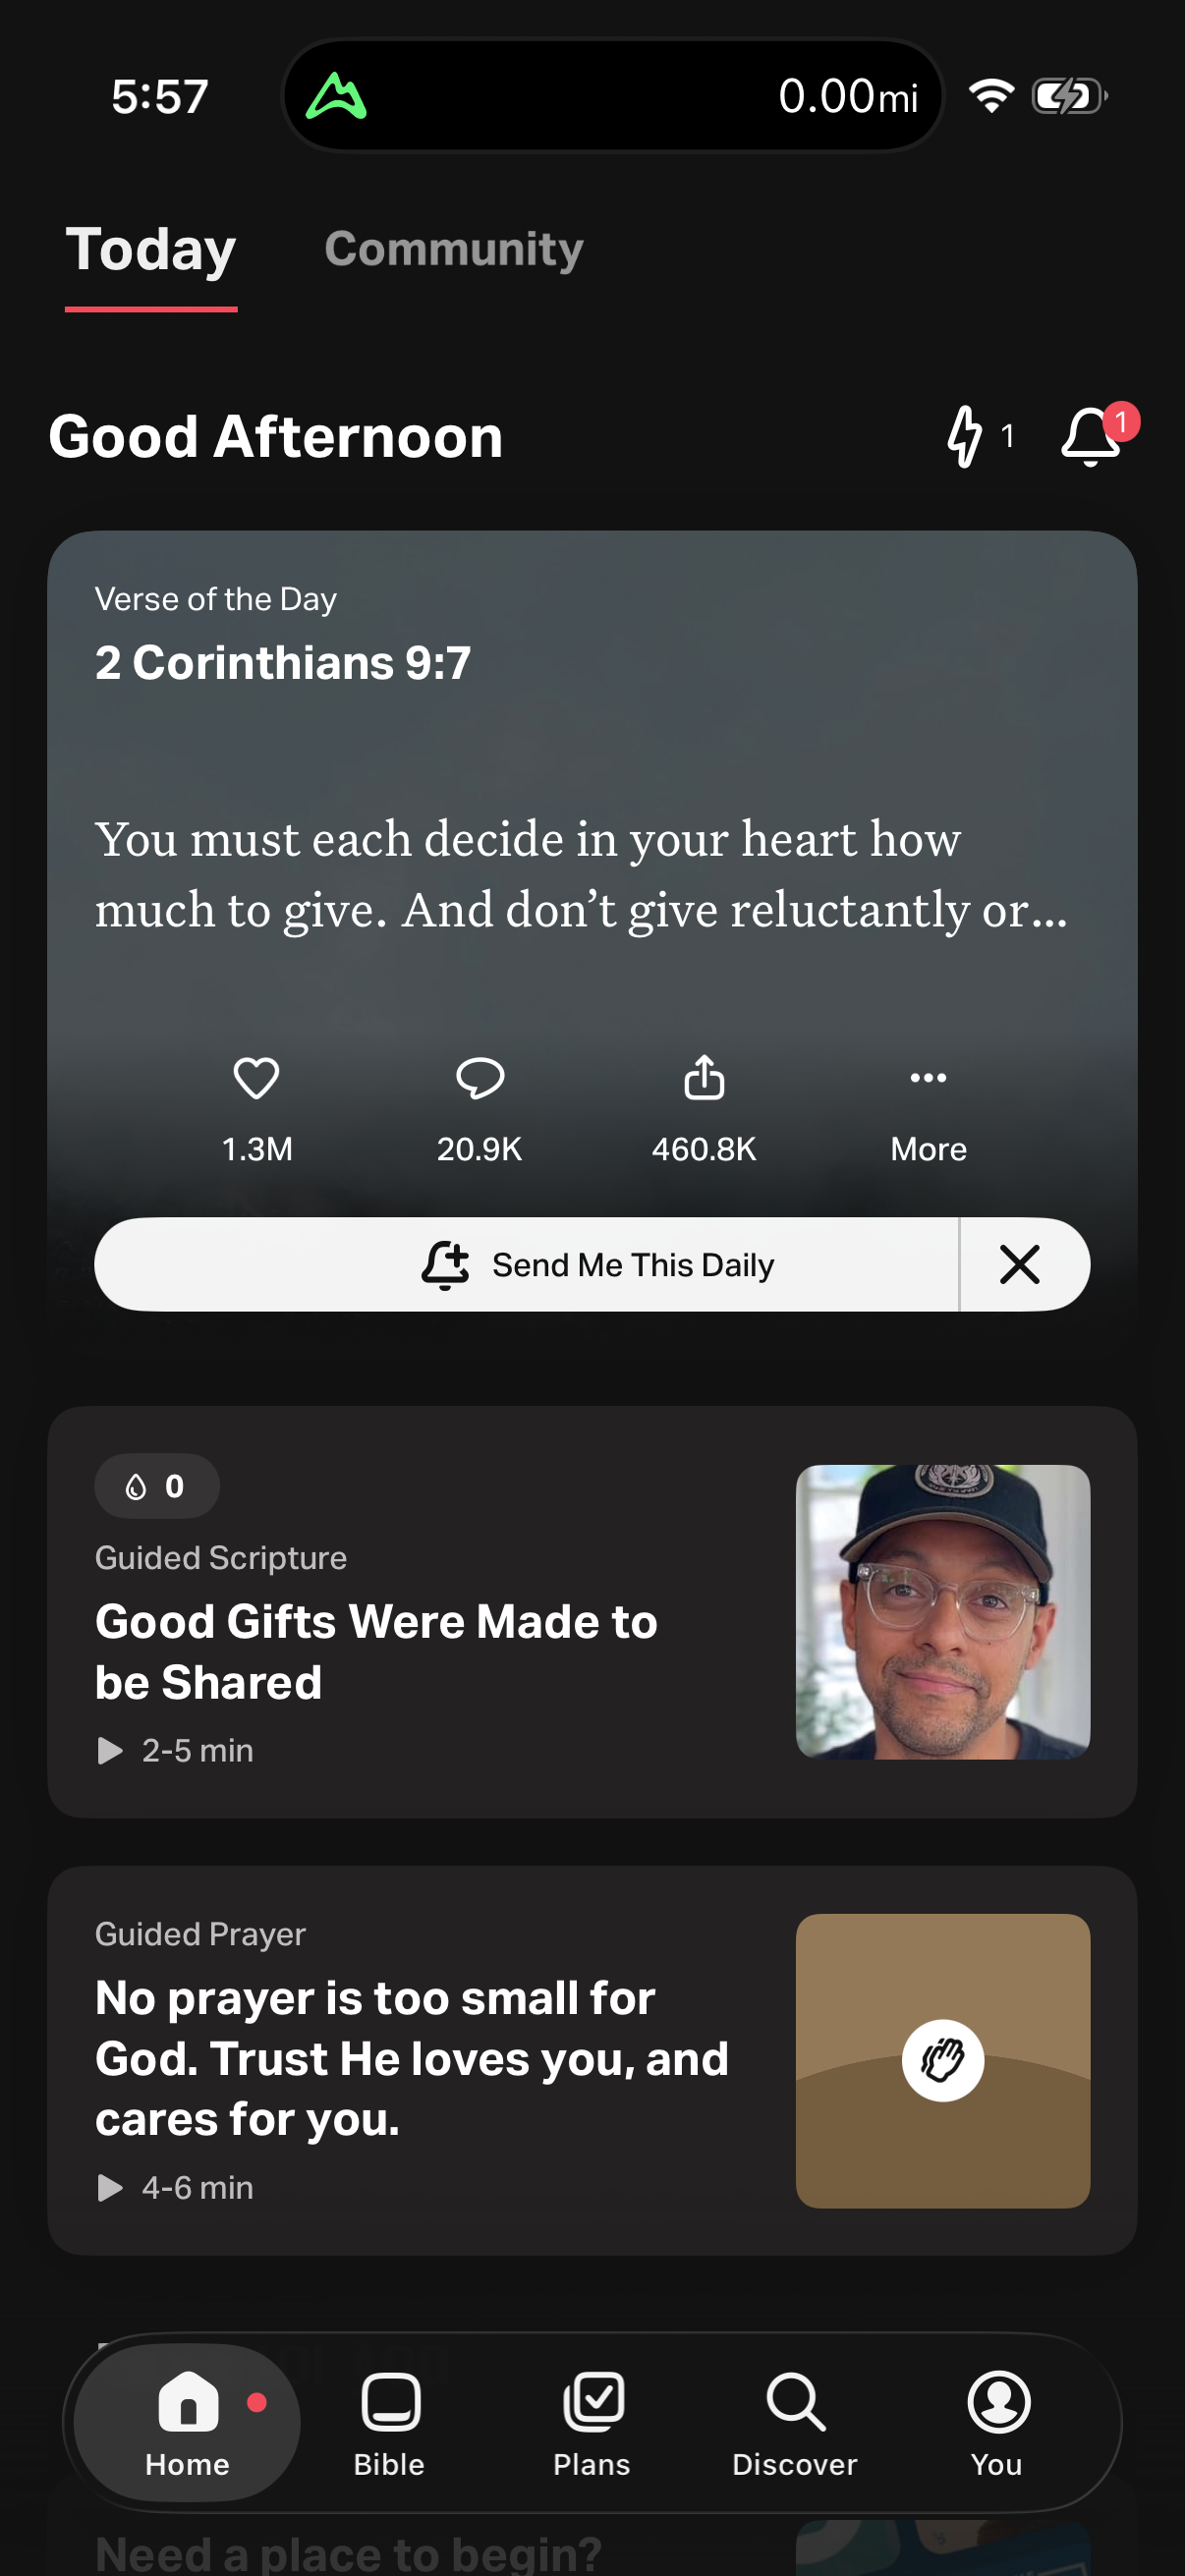
Across 809 tracked mobile apps, upgrade banners lead at 34% (271/809), followed by premium badges 22% (176), unlock CTAs 20% (159), lock-icon gating 12% (94), dedicated upsell cards 9% (71), and usage/limit gating 5% (44).[1] Use these as your baseline: anything you're deciding to build can be checked against how many apps already use it. Banners and badges are mainstream; usage meters and blur are niche.
Upgrade banners (34%) lead every in-product upsell mechanic; usage gating (5%) trails — across 809 apps, Lazyweb Research, July 2026.
| Item | Share |
|---|---|
| Upgrade banner / prompt | 34% |
| Premium / pro badge | 22% |
| Unlock CTA | 20% |
| Lock-icon gating | 12% |
| Dedicated upsell banner/card | 9% |
| Usage / limit gating | 5% |
| Blurred preview | <1% |
The full benchmark
All mechanics, ranked, over 809 apps (company-deduped):[1]
| Mechanic | Apps | Share | Screenshots |
|---|---|---|---|
| Upgrade banner / prompt | 271 | 34% | 2,531 |
| Premium / pro badge | 176 | 22% | 741 |
| Unlock CTA | 159 | 20% | 658 |
| Lock-icon gating | 94 | 12% | 410 |
| Dedicated upsell banner/card | 71 | 9% | 435 |
| Usage / limit gating | 44 | 5% | 69 |
| Blurred preview | 1 | <1% | 3 |
Separately, 35% of apps with a settings screen (112/321) carry an upgrade entry there.[3]
How to apply
Read the table as a build-priority guide. If you can ship one thing, ship the upgrade banner (34%). Add a premium badge (22%) and unlock CTA (20%) to label and convert gated features. Treat lock icons (12%) and dedicated cards (9%) as second-tier. Approach usage meters (5%) and blurred previews (<1%) as deliberate, untested bets rather than defaults.
Caveats
Every share is a lower bound from tightened LLM synonym tags, deduped by distinct company; mechanics overlap so shares don't sum to 100%.[1] Usage gating (44 apps/69 screenshots) and blurred preview (1 app) are small-sample — the latter is not a publishable standalone prevalence.[1] The settings figure uses a different denominator (321 apps with a settings screen).[3]
The numbers
| Stat | Computed from |
|---|---|
| 34% (271/809) | upgrade_banner_prompt_prevalence: 271/809 |
| 22% (176/809) | premium_badge_label_prevalence: 176/809 |
| 20% (159/809) | unlock_cta_prevalence: 159/809 |
| 12% (94/809) | lock_icon_gating_prevalence: 94/809 |
| 9% (71/809) | in_product_upsell_banner_card_prevalence: 71/809 |
| 5% (44/809) | usage_meter_limit_gating_prevalence: 44/809 |
| 1 app / 3 screenshots | smallSampleWarnings: blurred preview = 1 company / 3 screenshots |
| 35% (112/321) | upgrade_entry_in_settings: 112/321 |
Sources & citations
- [1] Lazyweb Research analysis of 809 apps (tracked mobile app corpus with screenshots), July 2026. Prevalence deduped by COUNT(DISTINCT company_name) over 44,873 tagged screenshots; tag patterns are LLM synonym phrases (tightened after spot-checking) so every stat is a lower bound. ↩
- [3] Lazyweb Research analysis of 23,407 canonical mobile screens (tracked app corpus), July 2026. Canonical-screen category counts; is_paywall is NULL on 21,824/23,407 rows so gating is reported as app-count prevalence or absolute screen counts, never as a share of all screens. ↩
Source: Lazyweb Research — proprietary analysis of real, in-market app screens. Cite as Lazyweb Research, 2026-07-07.