What Page Areas Are Productivity Companies A/B Testing?
Across 263 area-annotated experiments from productivity companies tracked by Lazyweb Research (117 experiments, 28 companies), the hero leads (51 annotations), with NAV, VALUE PROPS, and PRICING tied close behind at 41 each [1]. Productivity is the single most-annotated category and has the broadest company base (28), so its mix is the most representative in the dataset [1][2].
Productivity companies test HERO most (51 of 263 area annotations), with NAV, value props, and pricing tied at 41 each — Lazyweb Research analysis of 28 apps, July 2026.

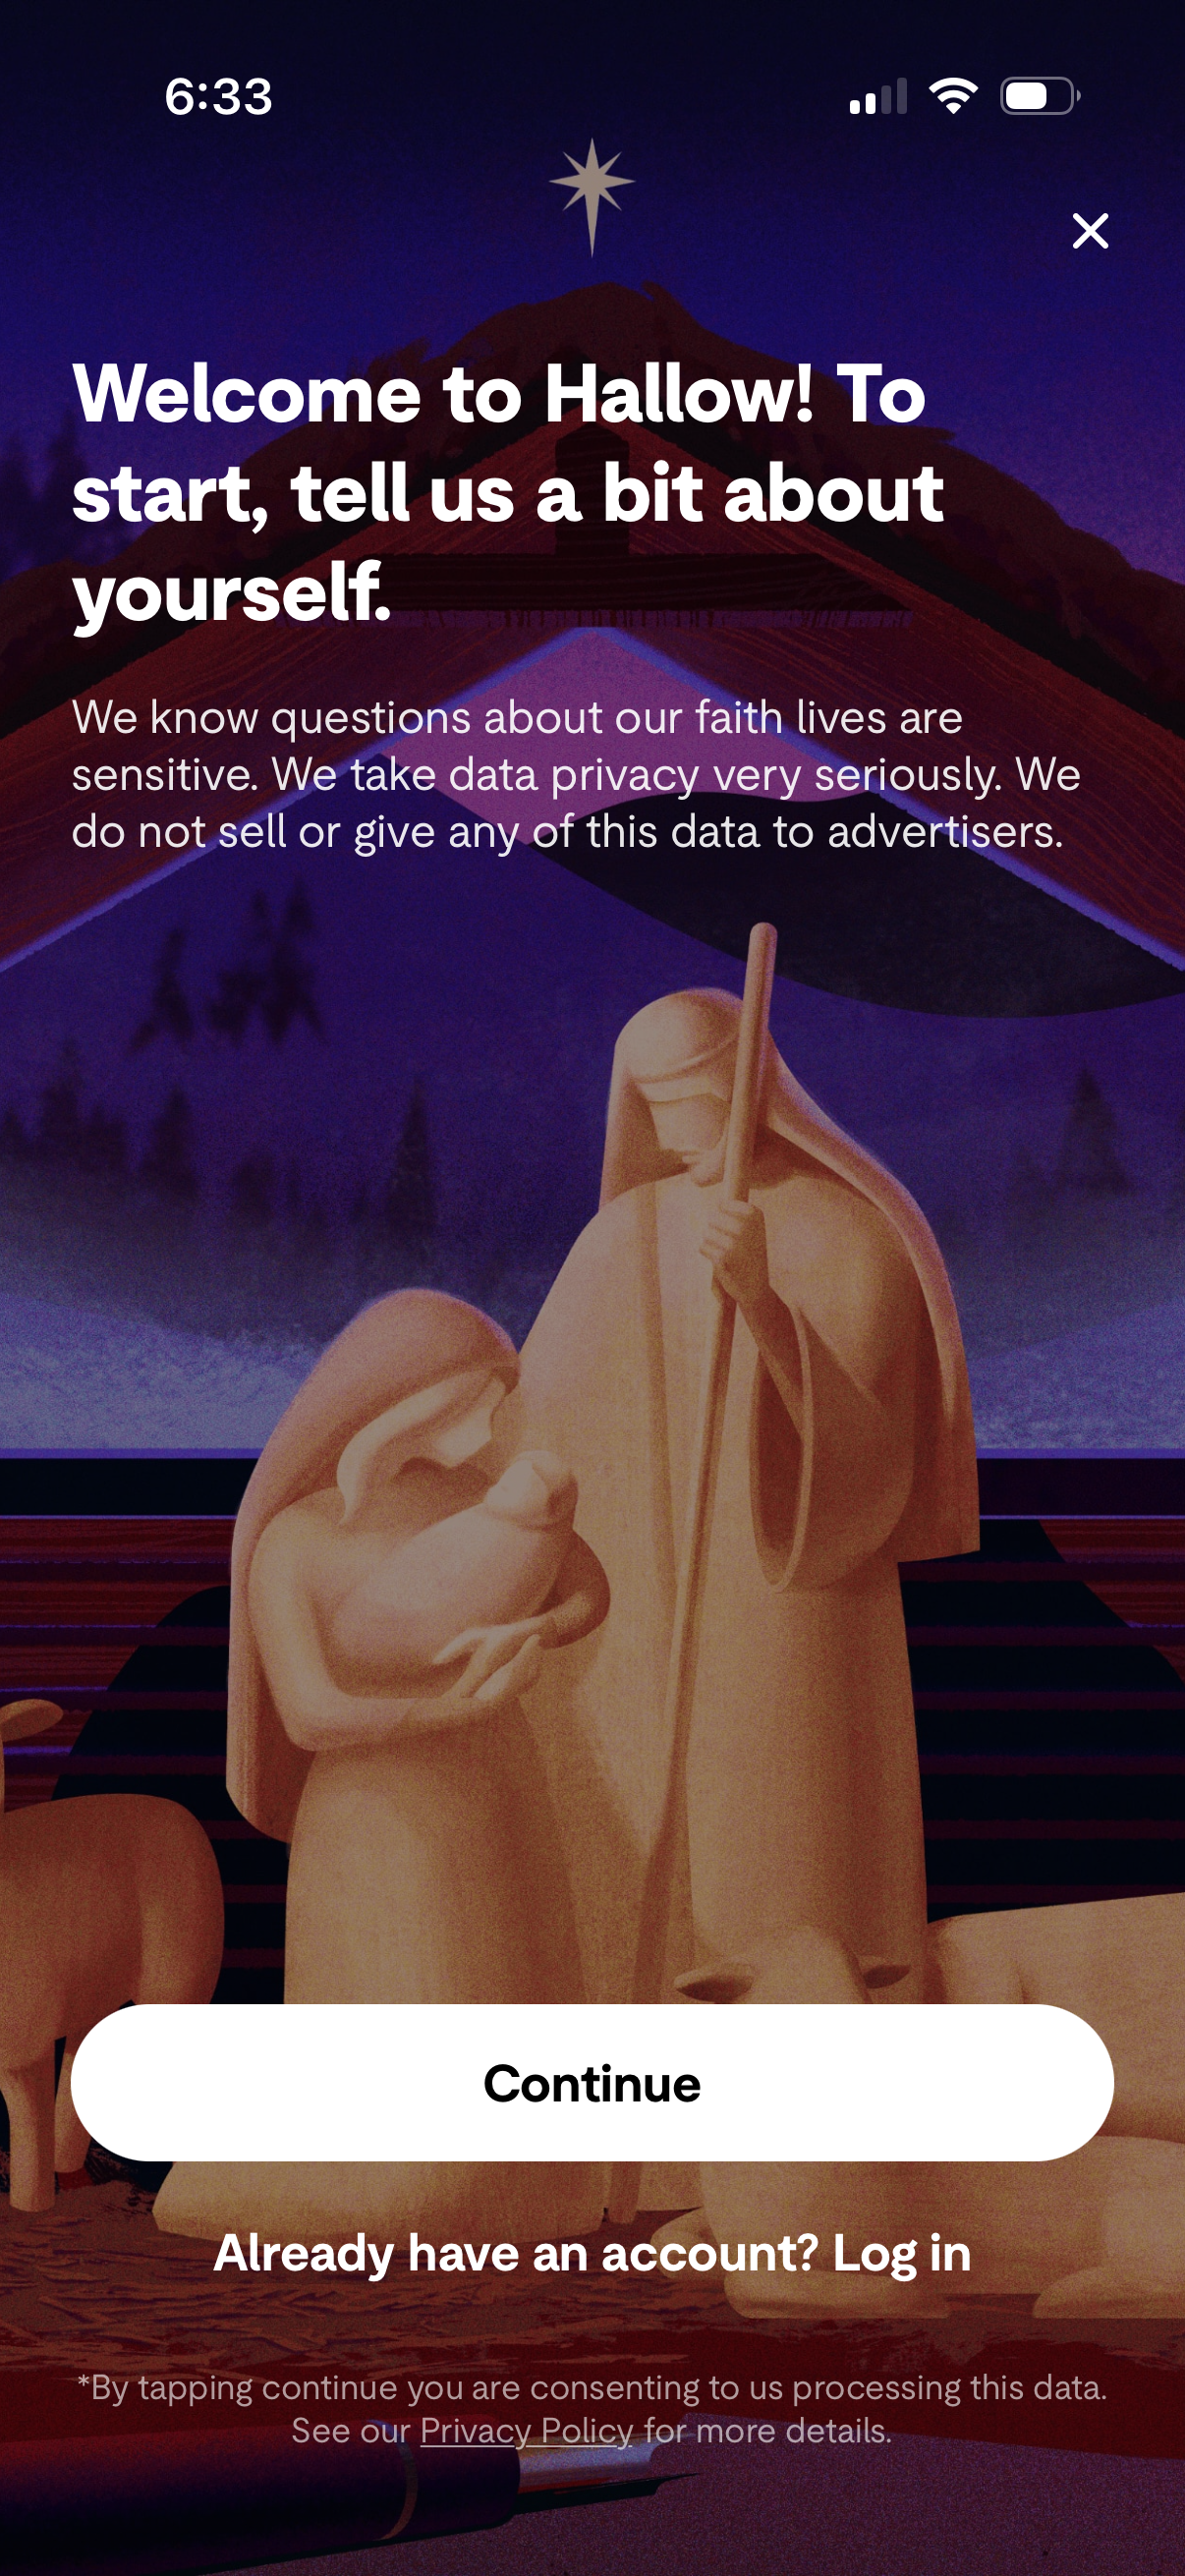
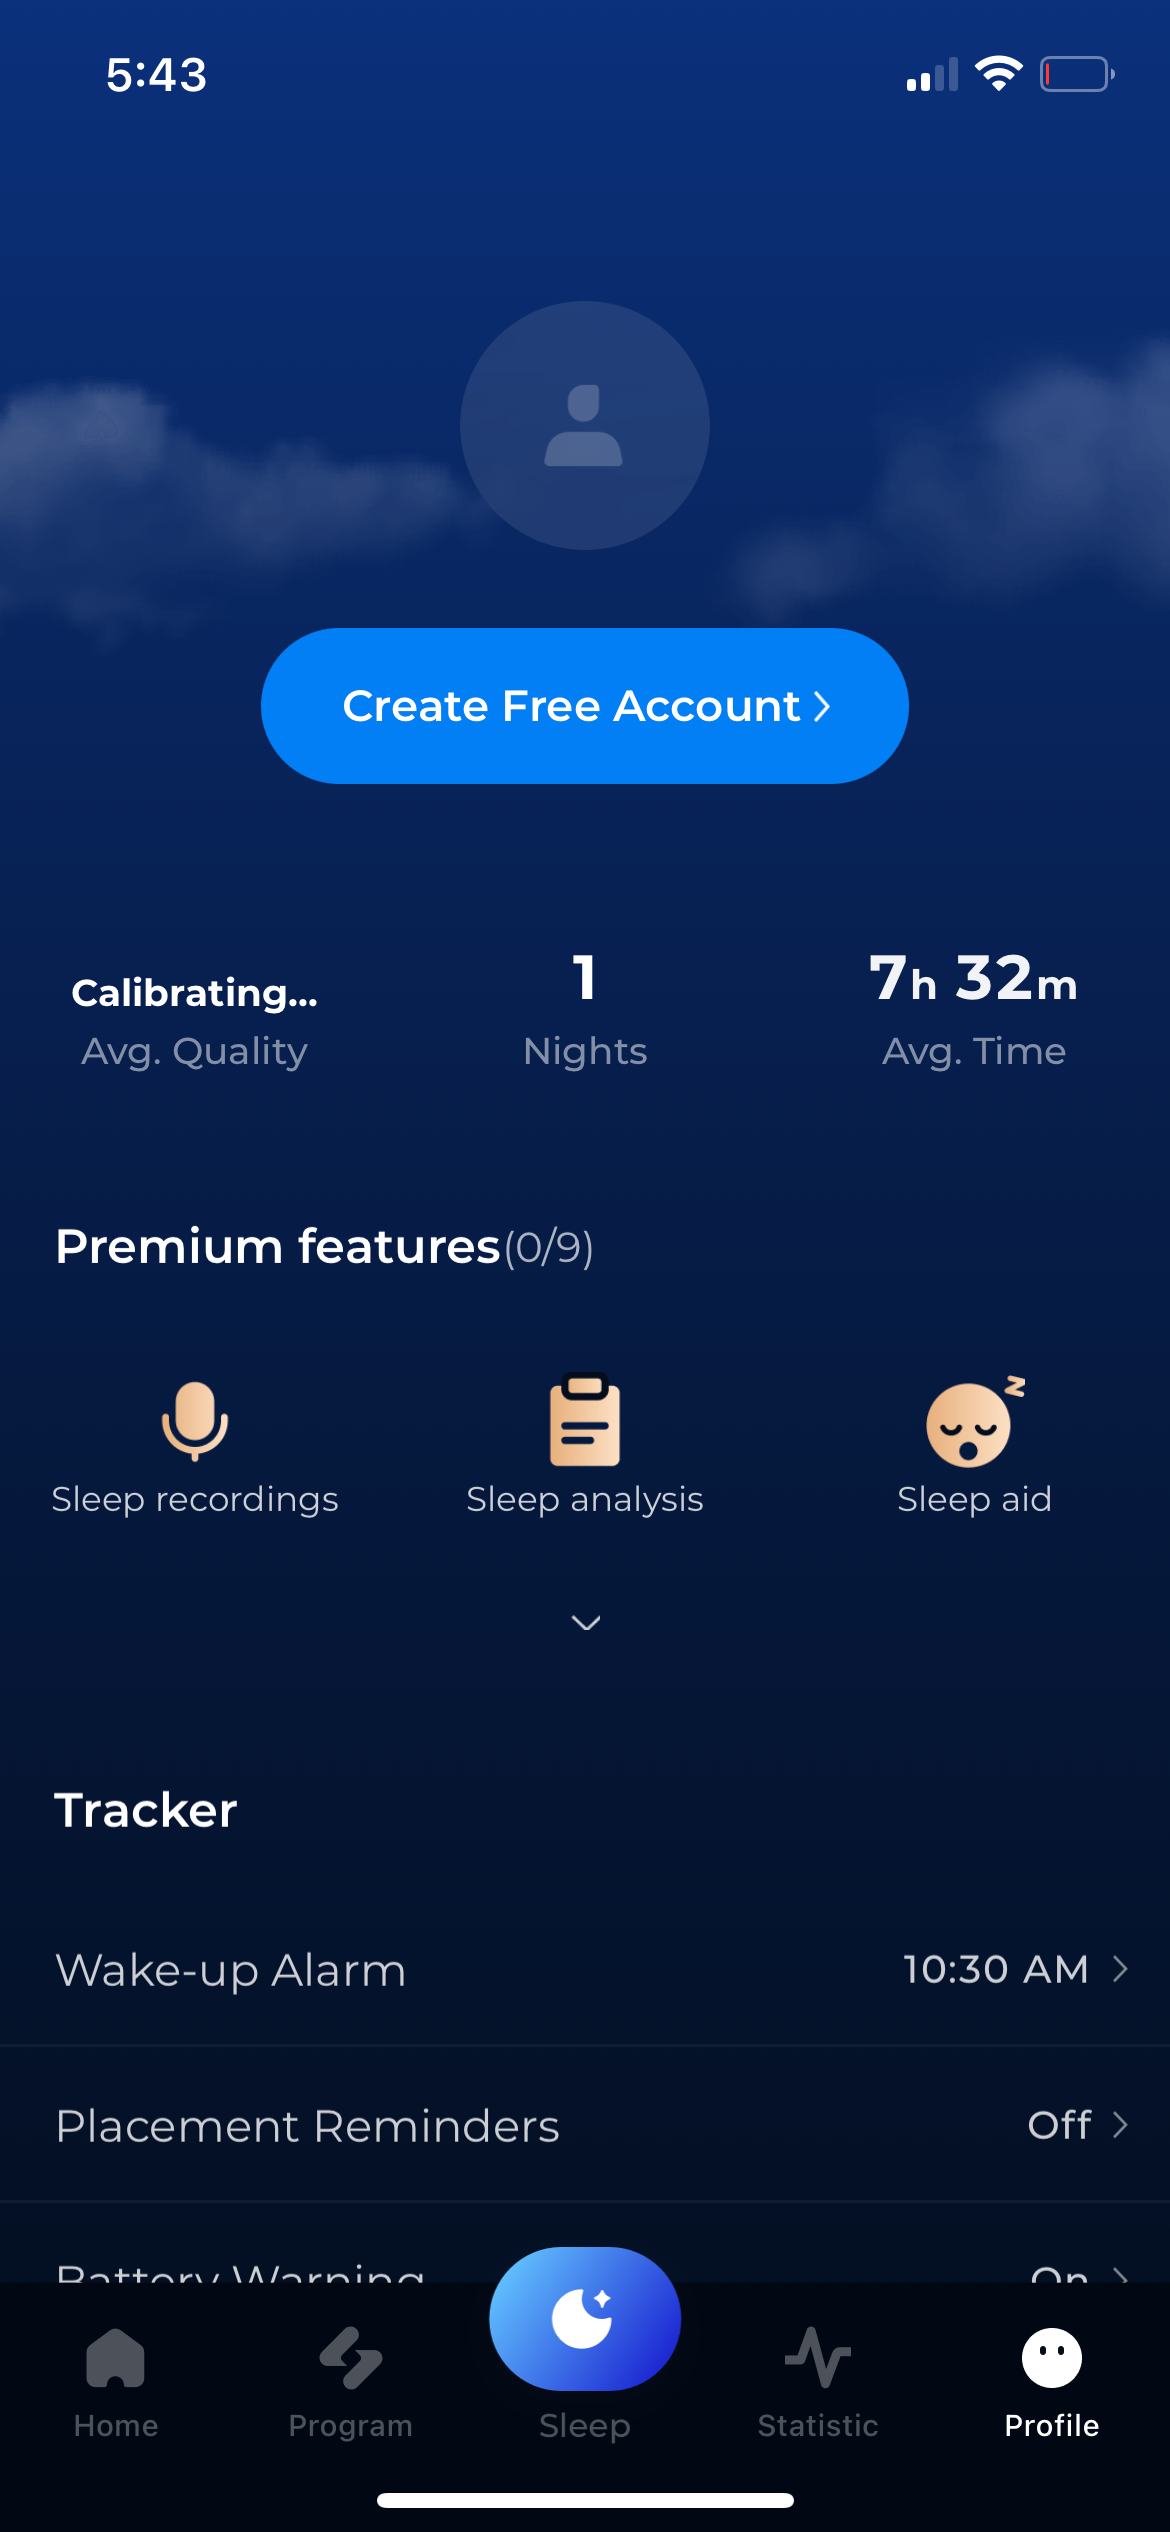

| Item | Annotations |
|---|---|
| HERO | 51 |
| NAV | 41 |
| VALUE PROPS | 41 |
| PRICING | 41 |
The finding: a balanced, hero-led mix
Productivity is the largest category cut: 263 annotations across 117 experiments and 28 companies — the widest company base of any category [1][2]. Its top area is HERO (51), followed by a three-way tie among NAV, VALUE PROPS, and PRICING at 41 each [1]. That balance is distinctive: most categories concentrate on two or three areas, but productivity spreads its testing across top-of-funnel, navigation, value props, and price fairly evenly [1].
Productivity top tested areas
Cells with n>=8 [1]:
| Area | Annotations |
|---|---|
| HERO | 51 |
| NAV | 41 |
| VALUE PROPS | 41 |
| PRICING | 41 |
The strong NAV presence (41) is notable — NAV is web-only corpus-wide, so productivity has a substantial web-landing-page testing footprint alongside its paywalls [1][3]. Slack (22), ChatGPT (17), and GitHub (11) are among the corpus's top testers [4].
How to apply it
For a productivity or SaaS tool, the peer pattern is a broad program: hero, nav de-chroming on landing pages, value props, and pricing all get roughly equal attention [1]. Because NAV and VALUE PROPS are lower-impact areas corpus-wide, lead with the hero and pricing for yield, and treat nav/value-prop tests as steady supporting work [1][3]. The breadth here suggests mature testing cultures rather than single-lever bets [1].
Caveats
263 annotations from 28 companies is the deepest, broadest cut — the most trustworthy category mix, but still an observed sample [2]. Only n>=8 cells shown [1]. NAV/VALUE PROPS impact figures are model-assigned relative scores, not lift [3].
The numbers
| Stat | Computed from |
|---|---|
| Productivity: 263 annotations, 117 experiments, 28 companies; top areas HERO 51, NAV 41, VALUE PROPS 41, PRICING 41 | category_totals; category_top_area |
| Productivity is the most-annotated category (263) with the broadest company base (28) | category_totals |
| NAV is web-only corpus-wide (all 144 annotations web); VALUE PROPS high-impact share 15.6% | area_NAV; high_impact_share_by_area |
| Slack (22), ChatGPT (17), GitHub (11) among top testers | top_testing_companies |
Sources & citations
- [1] Lazyweb Research analysis of 263 productivity-company experiments (28 apps), July 2026. Area annotations for productivity companies within 2,160 annotations. ↩
- [2] Lazyweb Research analysis of category annotation totals (~800 tracked apps), July 2026. Productivity is the largest category by annotations and company base. ↩
- [3] Lazyweb Research analysis of NAV and value-props areas (~800 tracked apps), July 2026. NAV is web-only; value-props high-impact share is low. ↩
- [4] Lazyweb Research analysis of top testing companies (~800 tracked apps), July 2026. Named productivity testers. ↩
Source: Lazyweb Research — proprietary analysis of real, in-market app screens. Cite as Lazyweb Research, 2026-07-07.