Which App Category Is Most Likely to Put the Price in the Paywall Button?
Among verticals with n>=70 primary paywall CTAs (~800 tracked apps), Graphics & Design is by far the most likely to embed price in the button at 25.0% (24 of 96 CTAs), followed by Photo & Video at 10.3% and Education at 9.0% [1]. Health & Fitness (3.8%) and Music (2.3%) almost never do it [1]. The corpus-wide baseline is 11.6% [2].
Graphics & Design puts a price in the paywall button on 25.0% of its CTAs — more than double the corpus-wide 11.6% baseline — while Music does so on just 2.3%, Lazyweb Research July 2026.
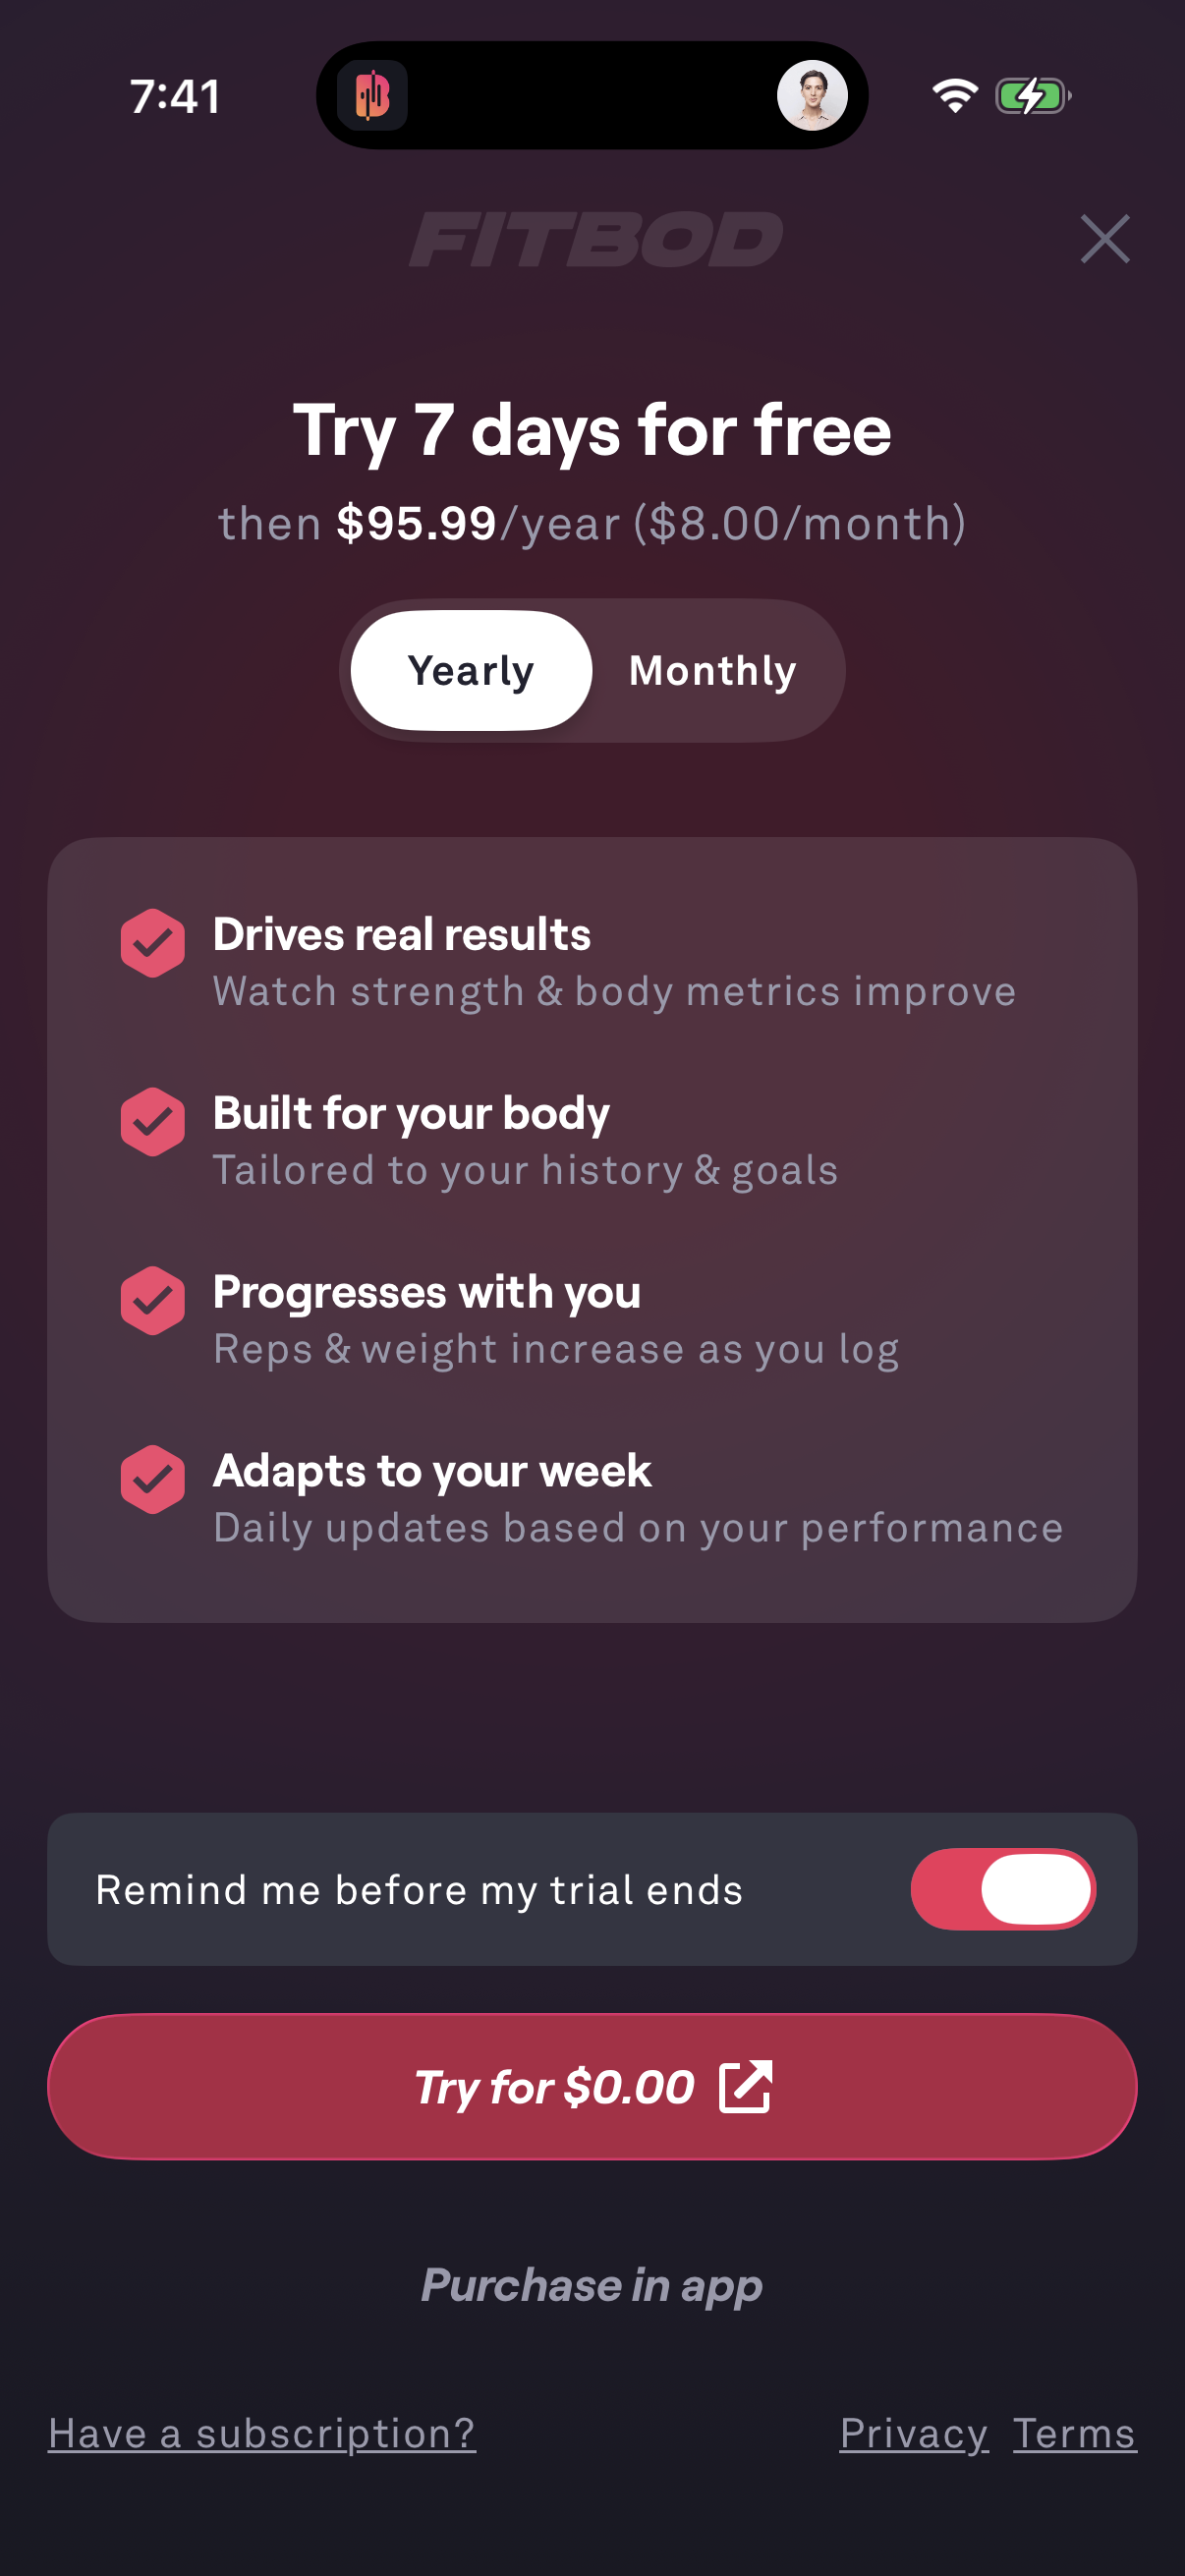
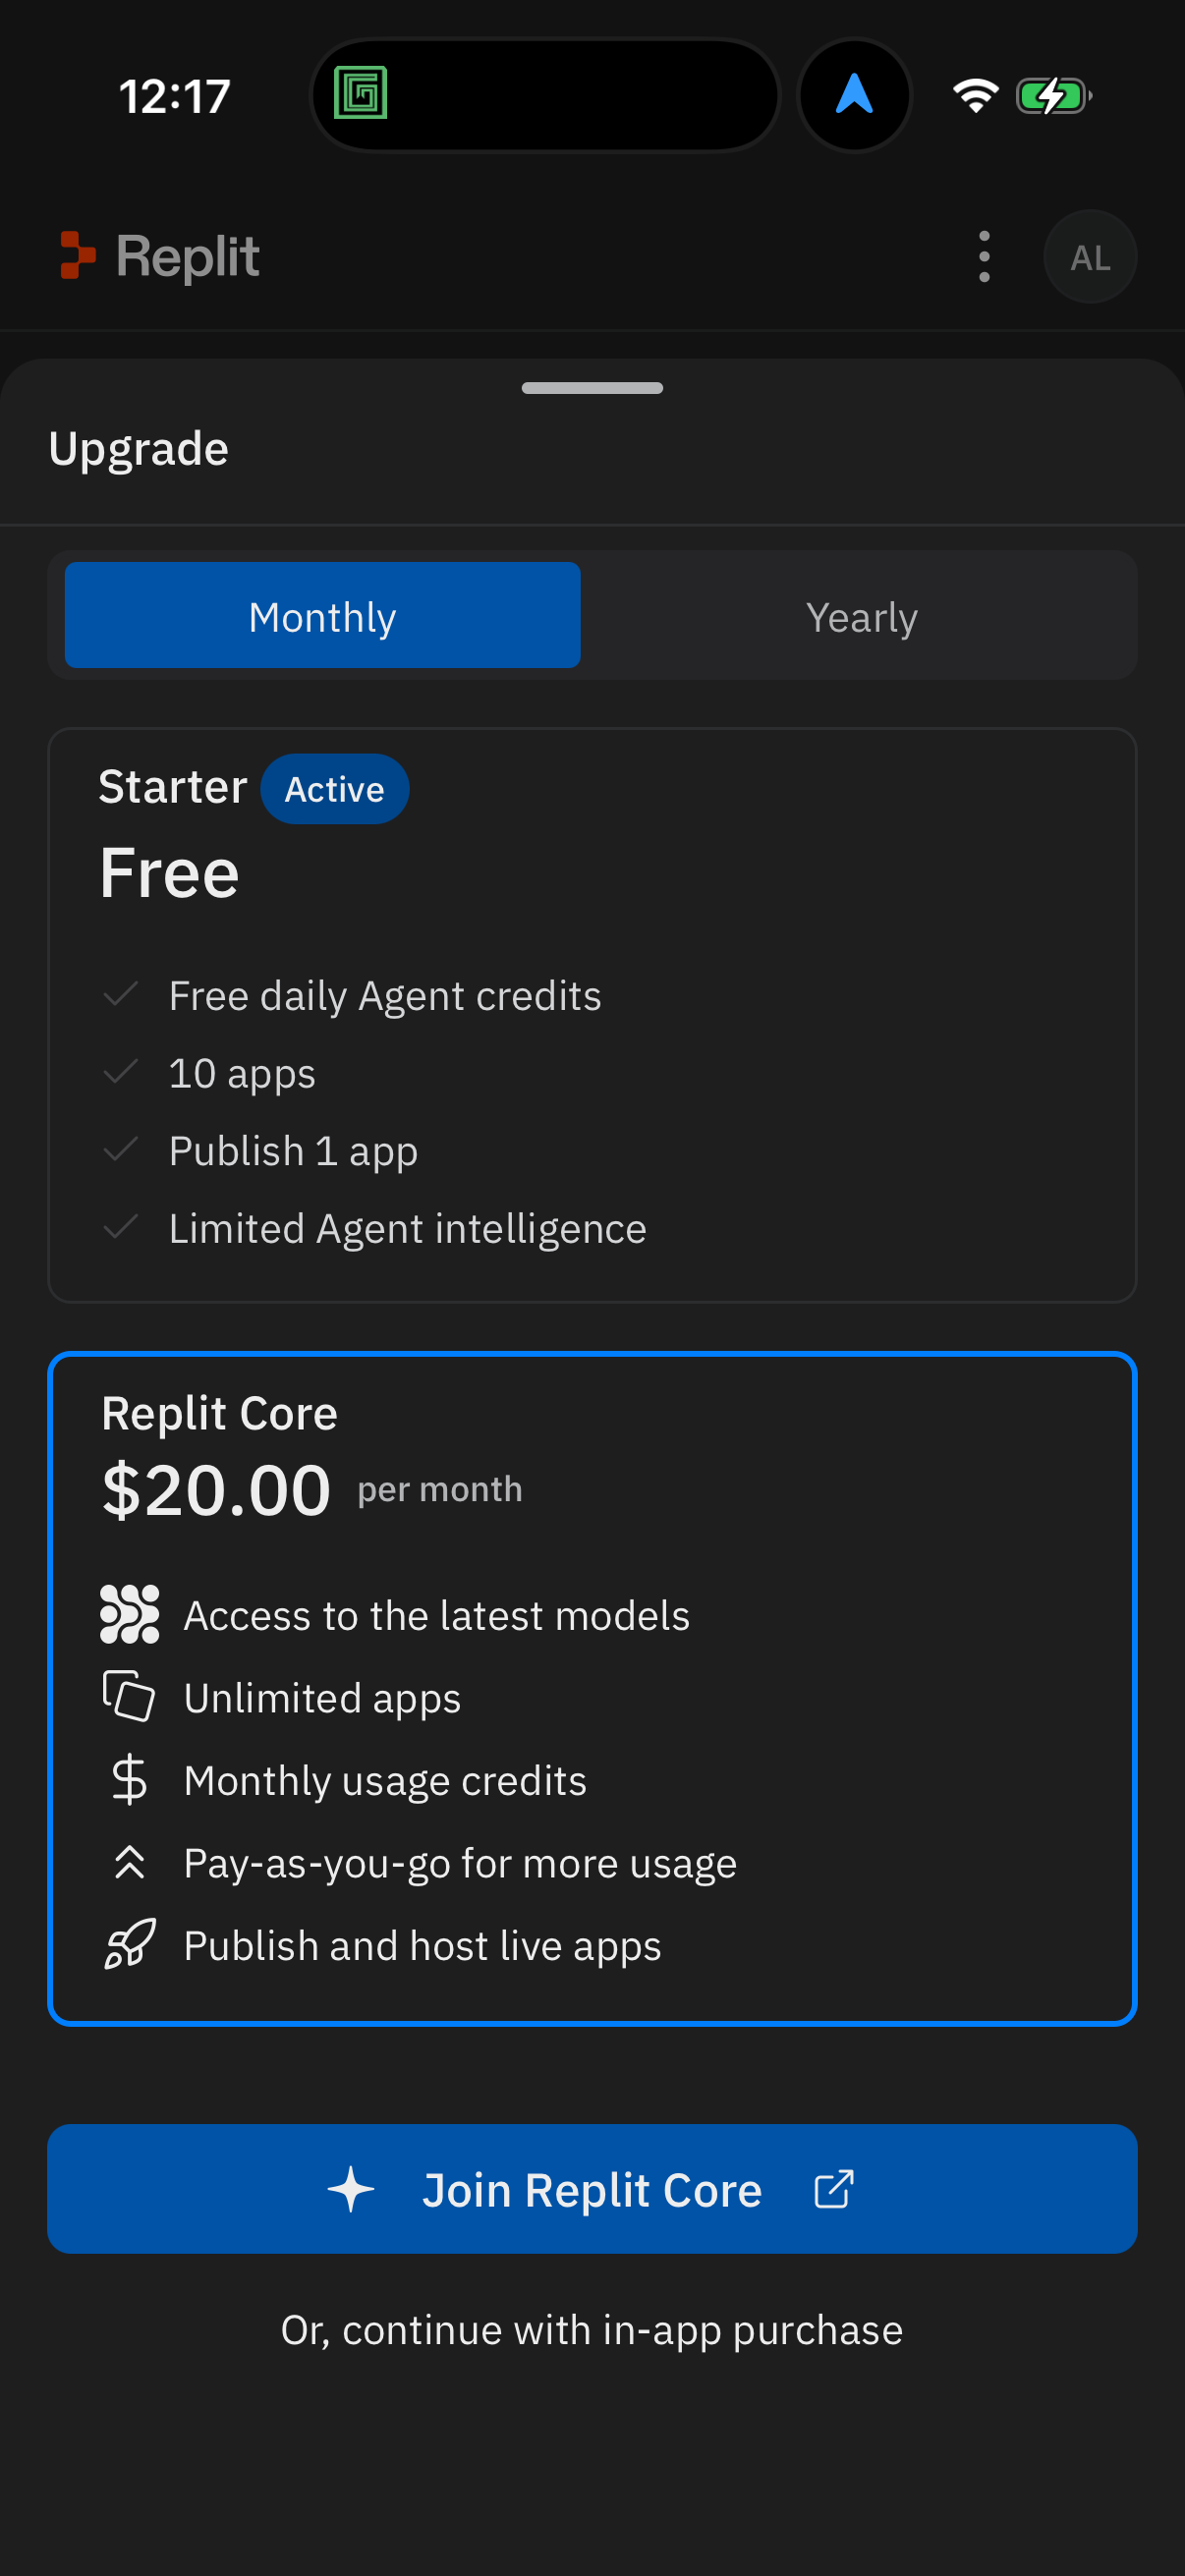
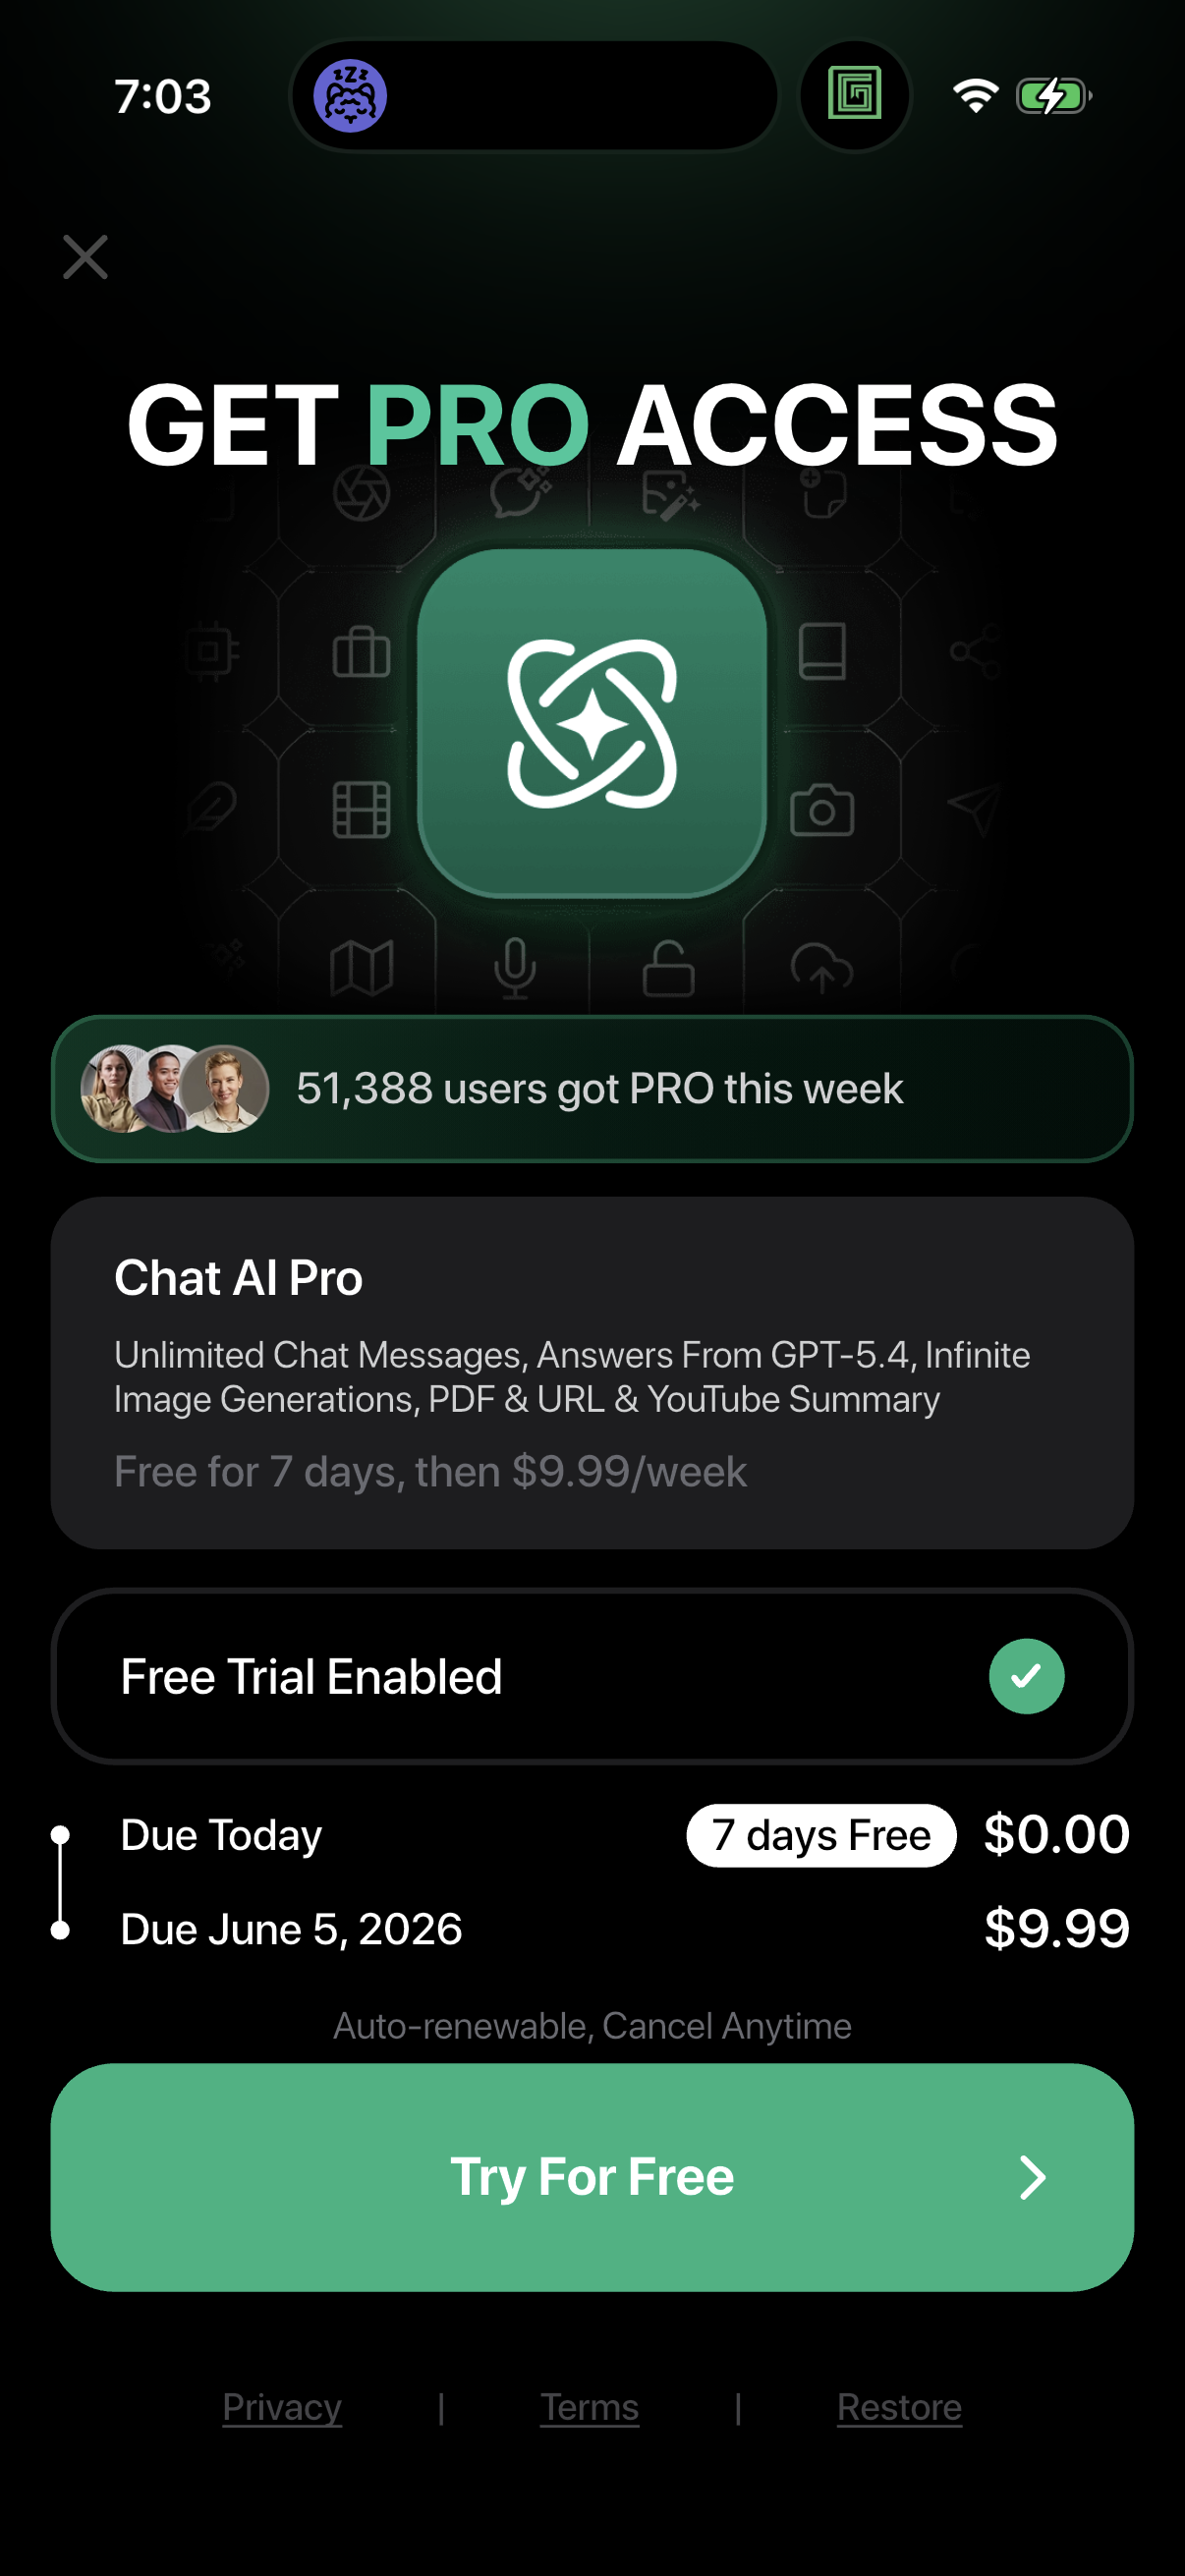
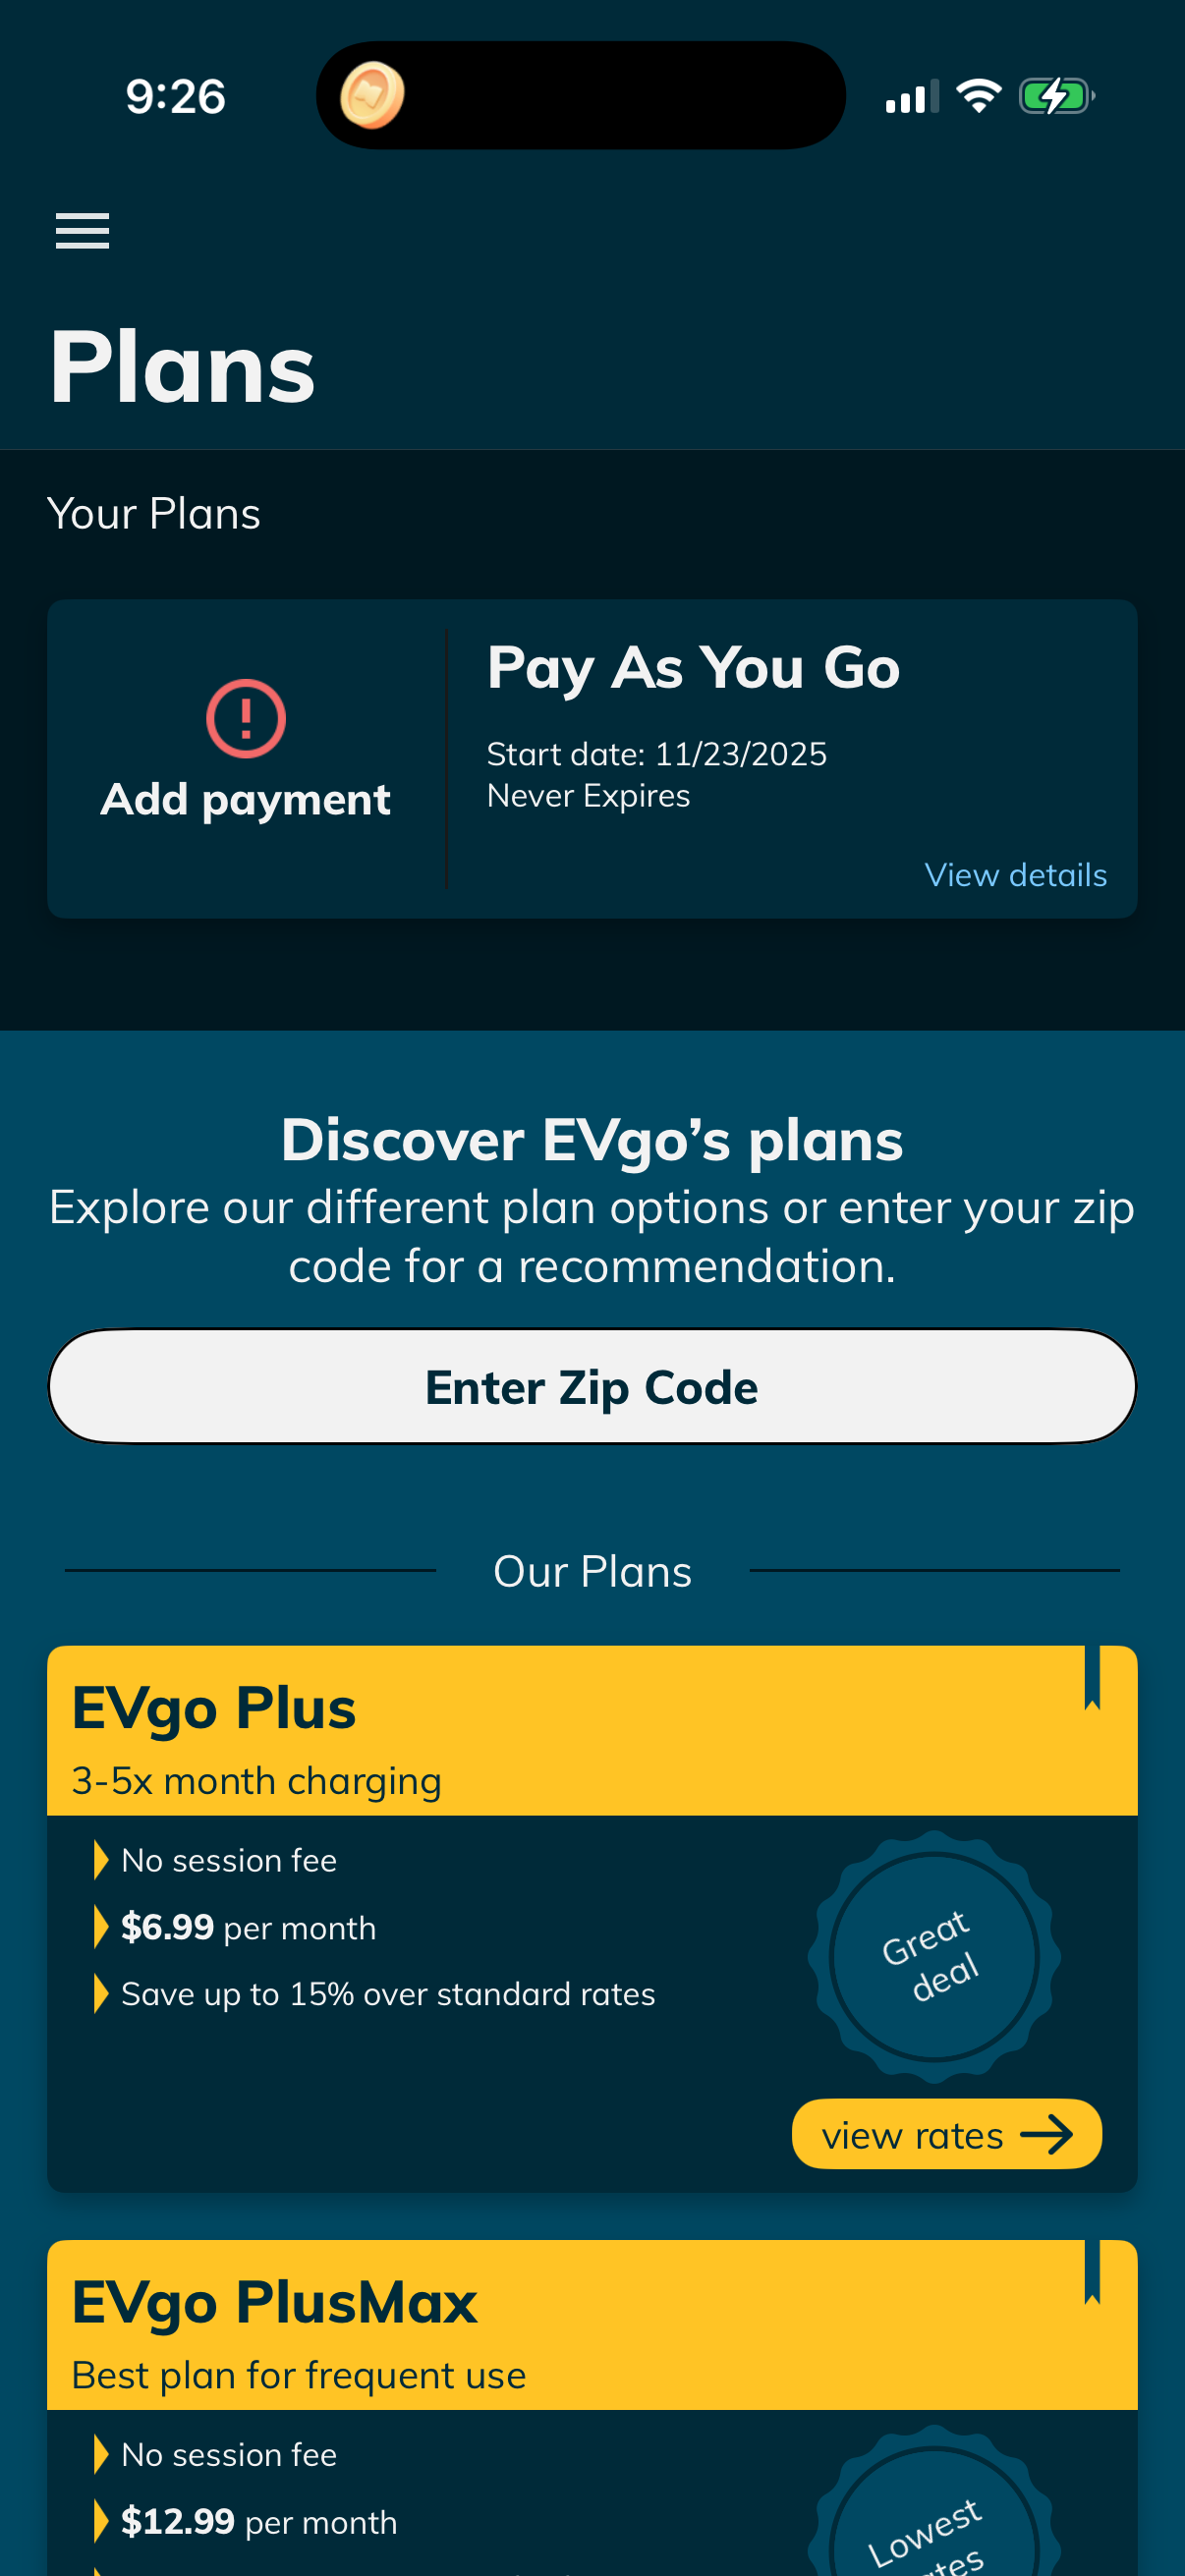
Most paywalls (70%) are direct with no price in the button; putting a price in the button is the exception in every quadrant. Source: Lazyweb Research, 630 paywalls.
| Quadrant | Contents |
|---|---|
| Trial-led / No price in button | Trial-led · no price — 108 (17%) |
| Trial-led / Price in button | Trial-led + price — 20 (3%) |
| Direct (no trial) / No price in button | Direct · no price — 443 (70%) |
| Direct (no trial) / Price in button | Direct + price — 59 (9%) |
| Item | Price-in-button share |
|---|---|
| Graphics & Design | 25.0% |
| Photo & Video | 10.3% |
| Education | 9.0% |
| Health & Fitness | 3.8% |
| Music | 2.3% |
| Corpus baseline | 11.6% |
The finding
Price-in-button prevalence swings sharply by category. Against a corpus baseline of 11.6% (219 of 1,886 primary CTAs), Graphics & Design more than doubles it at 25.0%, while Music and Health & Fitness sit near the floor at 2.3% and 3.8% [1][2]. The categories that surface price are the ones where the buyer decision is a direct purchase (creative tools, photo/video), not a trial-first habit build [1].
Ranking
| Vertical | Price-in-button share | n (apps) |
|---|---|---|
| Graphics & Design | 25.0% | 96 (9) |
| Photo & Video | 10.3% | 155 (15) |
| Education | 9.0% | 443 (26) |
| Health & Fitness | 3.8% | 340 (36) |
| Music | 2.3% | 128 (15) |
| Corpus baseline | 11.6% | 1,886 |
Only Graphics & Design and Photo & Video are at or above the corpus average; the trial-led verticals (Music, Health) fall well below it [1][2].
How to apply it
Use your category to decide whether an in-button price is expected. In creative and photo/video tools, showing price in the button is closer to a norm and worth testing as a transparency signal. In fitness, education and music — where the paywall leads with a trial — an in-button price is off-pattern and may undercut the 'free to start' message. The '$0.00 trial' framing is the exception that puts a price in the button precisely to signal free [1].
Caveats
Graphics & Design's 25.0% rests on only 9 companies, so read it as directional [3]. The regex captures currency symbols and per-period markers; unusual formats may be missed [2]. All five verticals clear the n>=70 threshold; 39% of the full corpus is role='unknown' and excluded [2].
The numbers
| Stat | Computed from |
|---|---|
| price-in-button by vertical: Graphics & Design 25.0% (24/96); Photo & Video 10.3% (16/155); Education 9.0% (40/443); Health & Fitness 3.8% (13/340); Music 2.3% (3/128) | graphics_design_top_ctas, photo_video_top_ctas, education_top_ctas, health_fitness_top_ctas, music_top_ctas |
| corpus baseline price-in-button = 11.6% (219/1886), 57 companies | price_in_button_primary |
| Graphics & Design has only 9 distinct companies despite n=96 | smallSampleWarnings |
Sources & citations
- [1] Lazyweb Research analysis of 1,162 primary paywall CTAs across five verticals (~800 tracked apps), July 2026. Per-vertical price-in-button shares. ↩
- [2] Lazyweb Research analysis of 1,886 primary paywall CTAs (~800 tracked apps), July 2026. Corpus-wide price-in-button baseline 11.6%; regex over currency/period markers. ↩
- [3] Lazyweb Research analysis of 96 primary paywall CTAs from 9 Graphics & Design apps (~800 tracked apps), July 2026. 9-company caveat on the 25.0% figure. ↩
Source: Lazyweb Research — proprietary analysis of real, in-market app screens. Cite as Lazyweb Research, 2026-07-07.