Which app categories show up most in cancel-flow research?
Among the 48 apps with genuine cancel-intent screens, Health & Fitness is the largest category cell with 7 apps, followed by Education (6) and Productivity (4) [1]. Every per-category cell is below N=8, so read these as illustrative counts, never as rates [2]. The honest takeaway: subscription-heavy categories dominate the sample, but the counts are too small to rank precisely.
Health & Fitness (7 apps) is the largest cancel-flow category cell — still below N=8, July 2026.
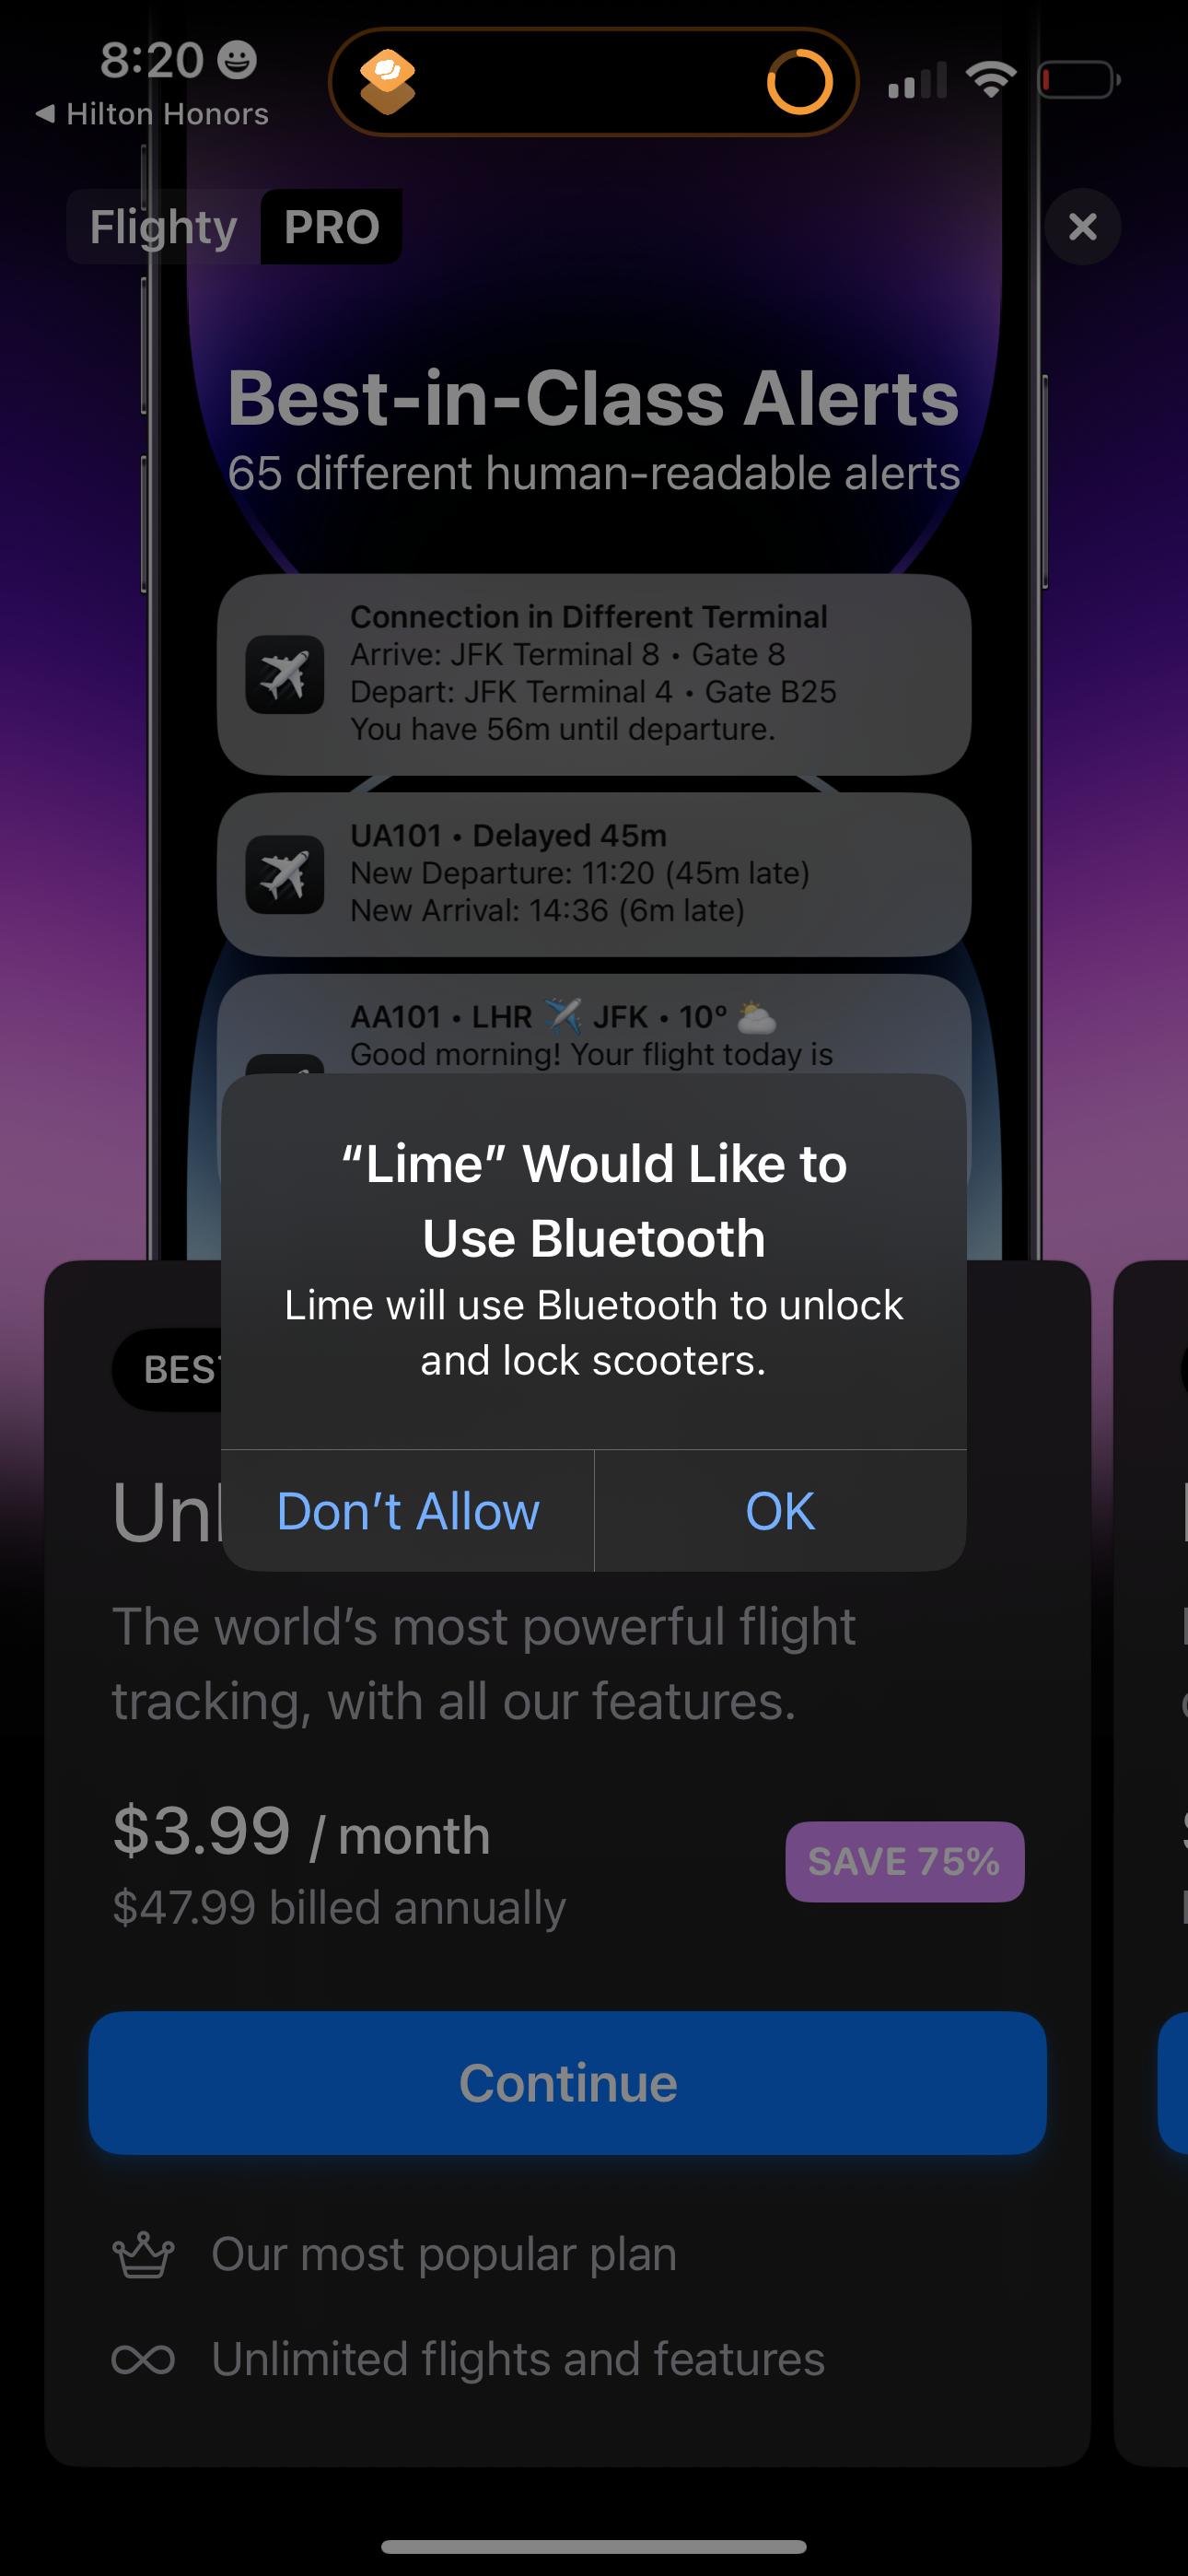
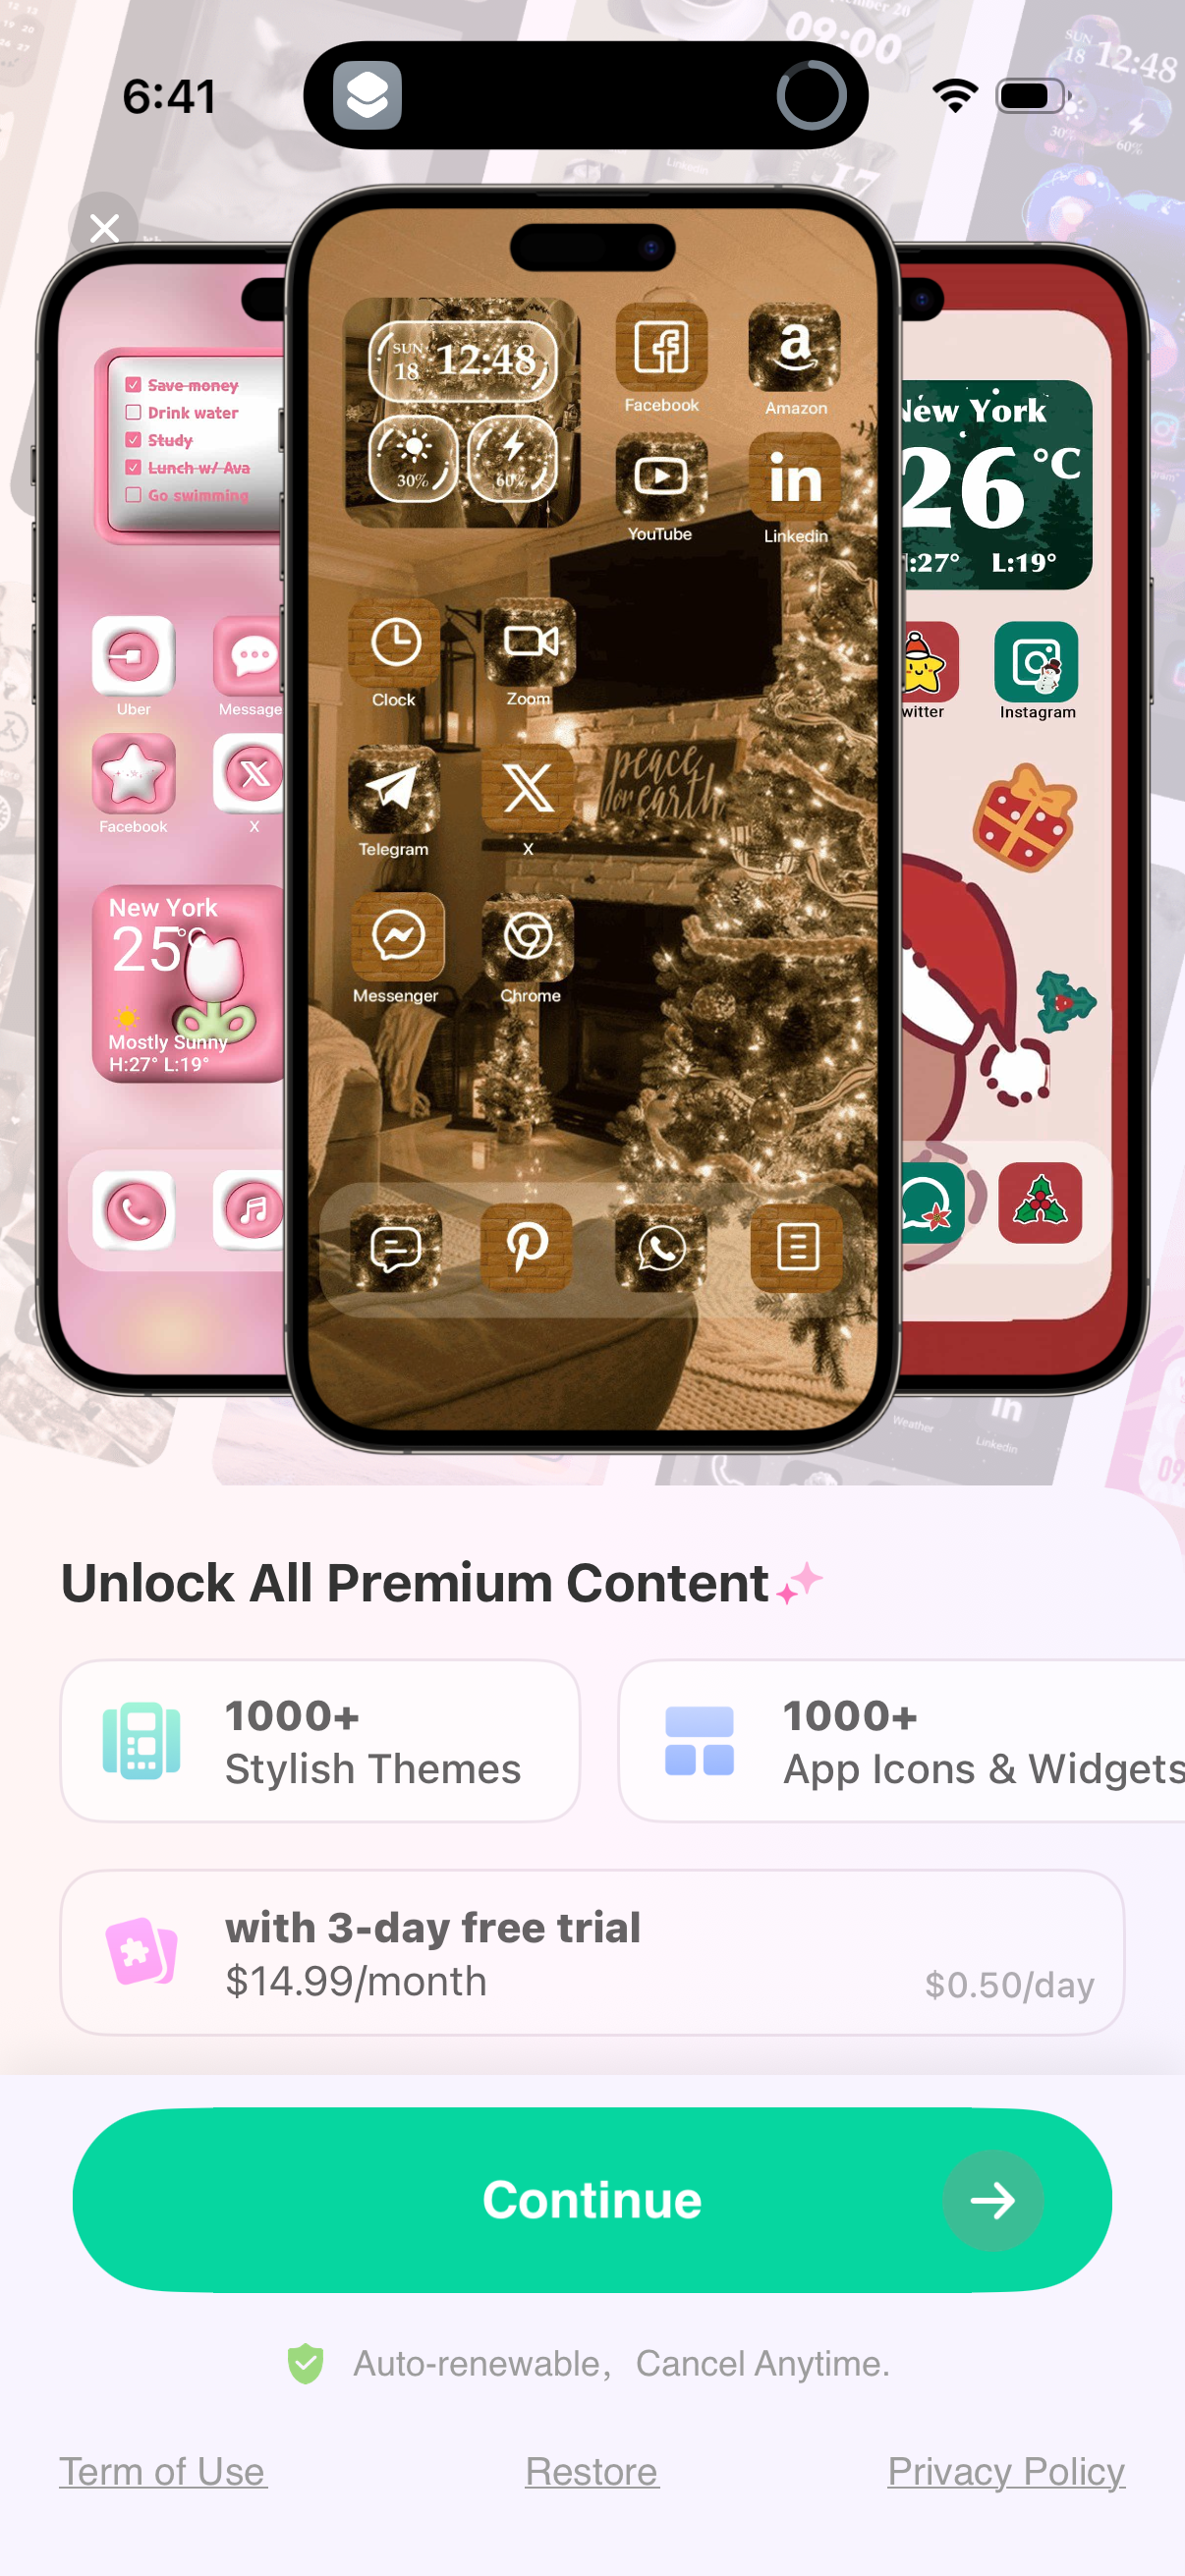
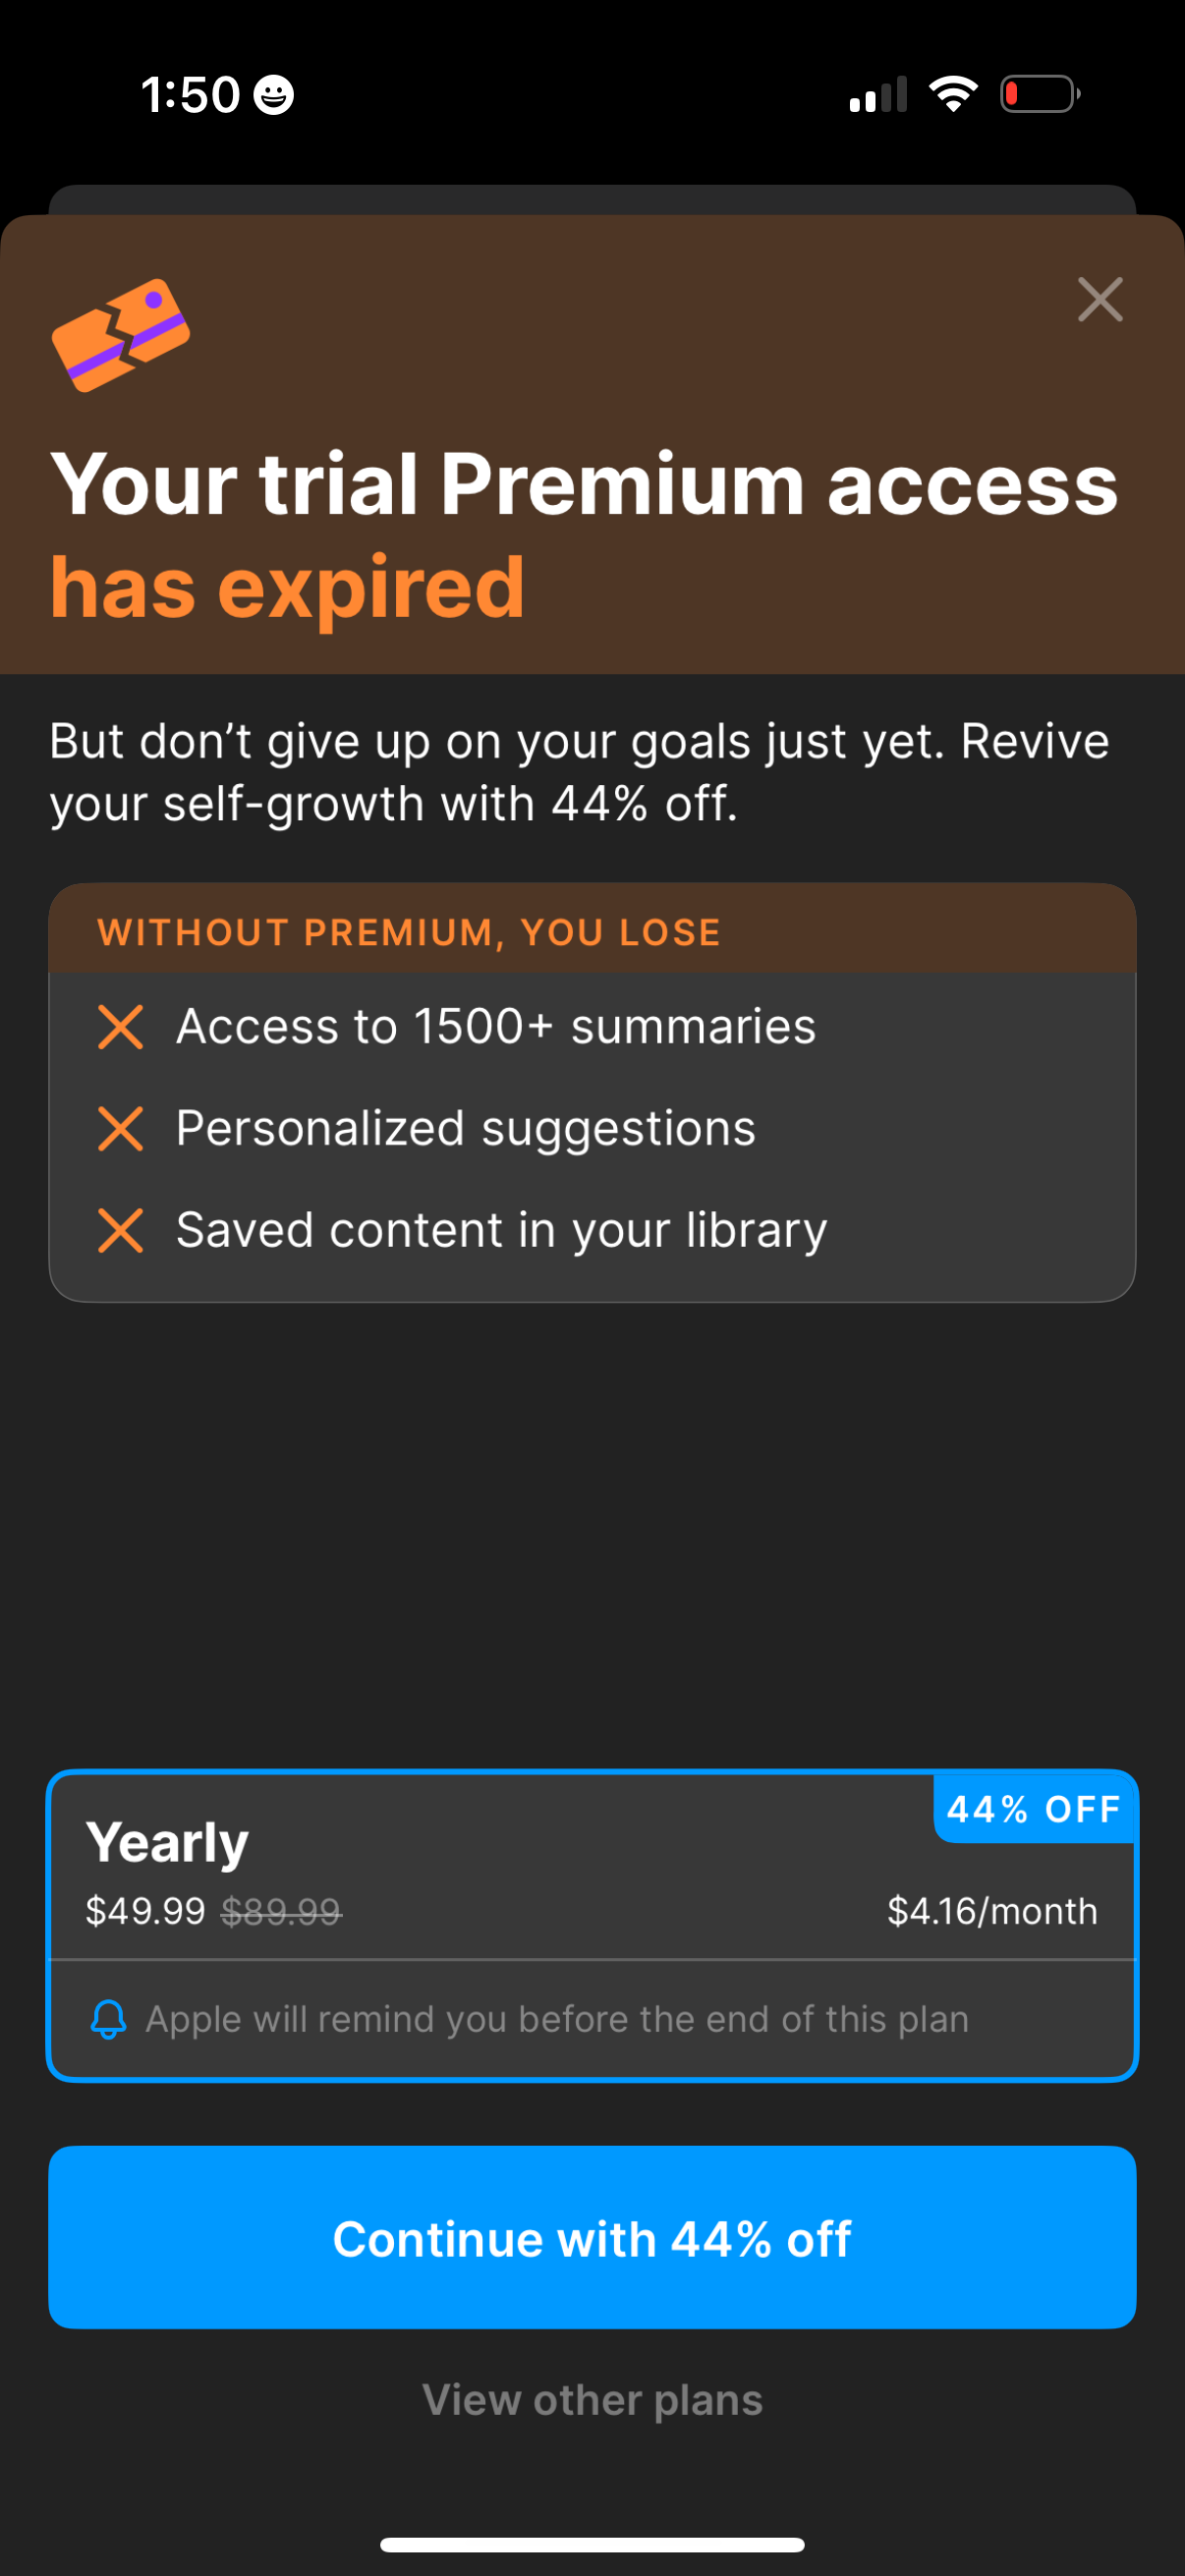
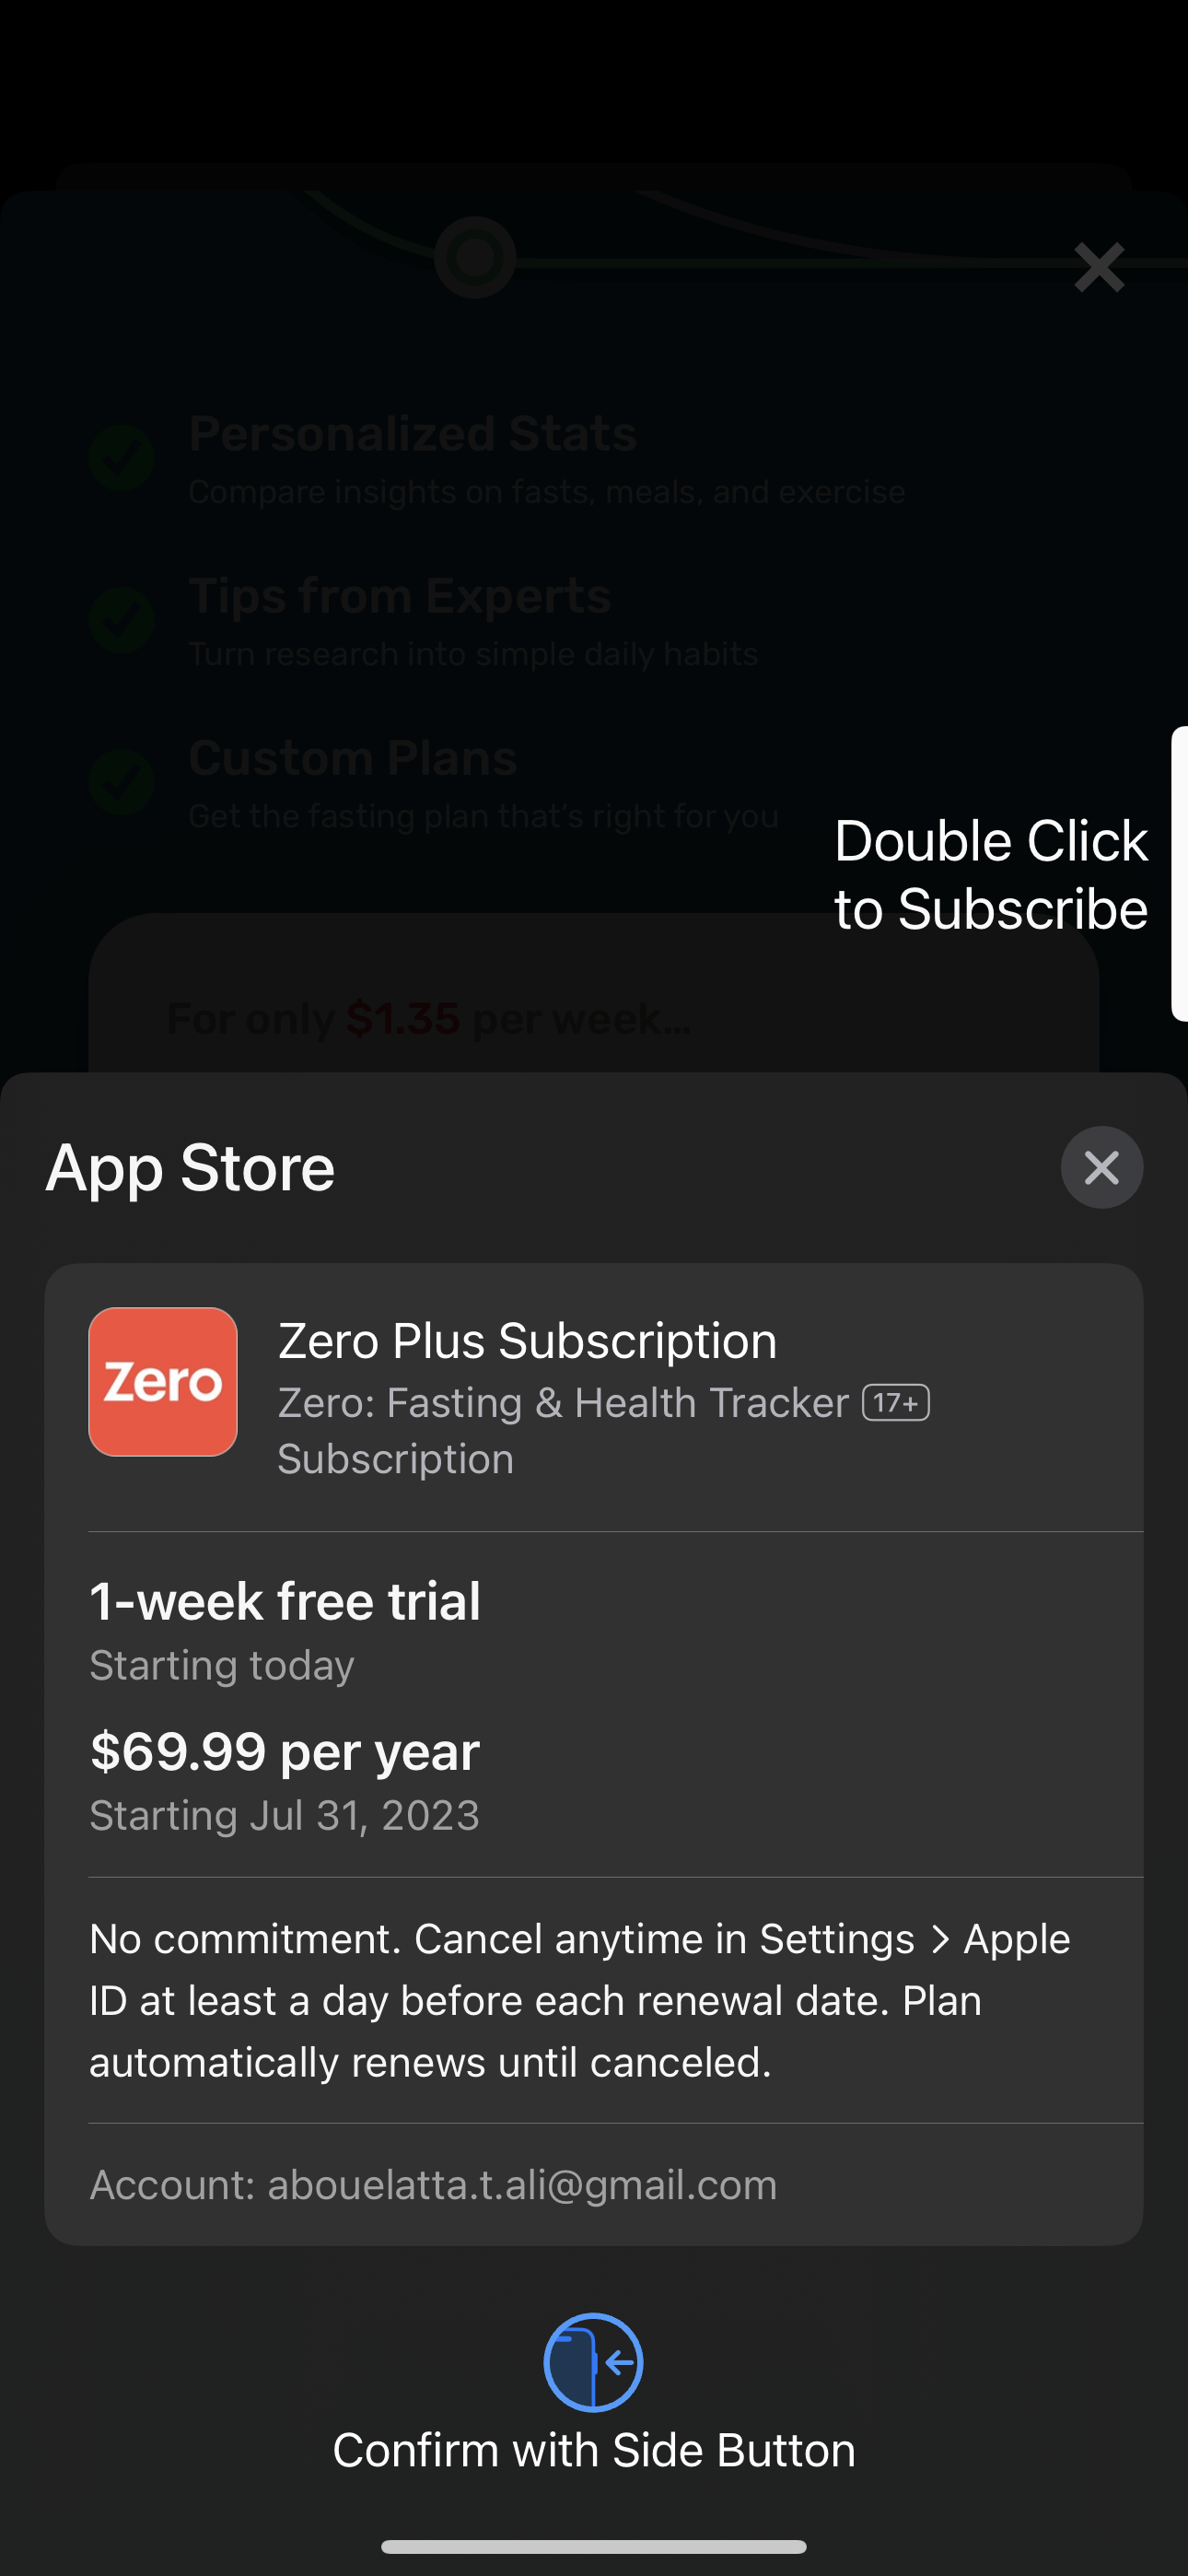
| Item | Apps with cancel screens |
|---|---|
| Health & Fitness | 7 [1] |
| Education | 6 [1] |
| Productivity | 4 [1] |
| Books / Food & Drink / Photo & Video / Weather | 3 each [1] |
Category counts (illustrative)
| Category | Apps with cancel screens |
|---|---|
| Health & Fitness | 7 [1] |
| Education | 6 [1] |
| Productivity | 4 [1] |
| Books / Food & Drink / Photo & Video / Weather | 3 each [1] |
Health & Fitness leads, but at 7 apps it still sits below the N=8 reliability bar [1][2].
Why these are counts, not rates
Every category cell here is N<8, including the largest [2]. Converting 7-of-48 or 6-of-48 into category percentages would over-state precision, so we report raw counts only [2]. The pattern that subscription-heavy categories (fitness, education, productivity) surface the most cancel screens is directional and unsurprising, not a ranked leaderboard.
How to apply it
Use this to sanity-check that your peer set exists in the sample — if you build in Health & Fitness or Education, there are real captured cancel flows to compare against [1]. Do not use these counts to claim one category cancels 'more' than another; the sample is too thin for that [2]. For tactic-level benchmarks, fall back to the pooled 48-app rates (discount 63%, confirm 25%, keep/stay 21%) [3].
The numbers
| Stat | Computed from |
|---|---|
| Cancel-flow apps by category: Health & Fitness 7, Education 6, Productivity 4, Books/Food & Drink/Photo & Video/Weather 3 each | cancel_flow_apps_by_category |
| All per-category cancel-flow cells are N<8 (max 7) | smallSampleWarnings / cancel_flow_apps_by_category |
| Pooled 48-app rates: discount 63%, confirm 25%, keep/stay 21% | save_offer_offer_language / confirmation_dialog / keep_stay_cta |
Sources & citations
- [1] Lazyweb Research analysis of 48 apps (genuine cancel-intent screens), July 2026. Company-level cancel-flow apps by app category; all cells N<8. ↩
- [2] Lazyweb Research analysis of 48 apps (genuine cancel-intent screens), July 2026. Pooled tactic rates used when per-category cells are too small. ↩
Source: Lazyweb Research — proprietary analysis of real, in-market app screens. Cite as Lazyweb Research, 2026-07-07.