What percent of mobile apps have biometric or passkey login?
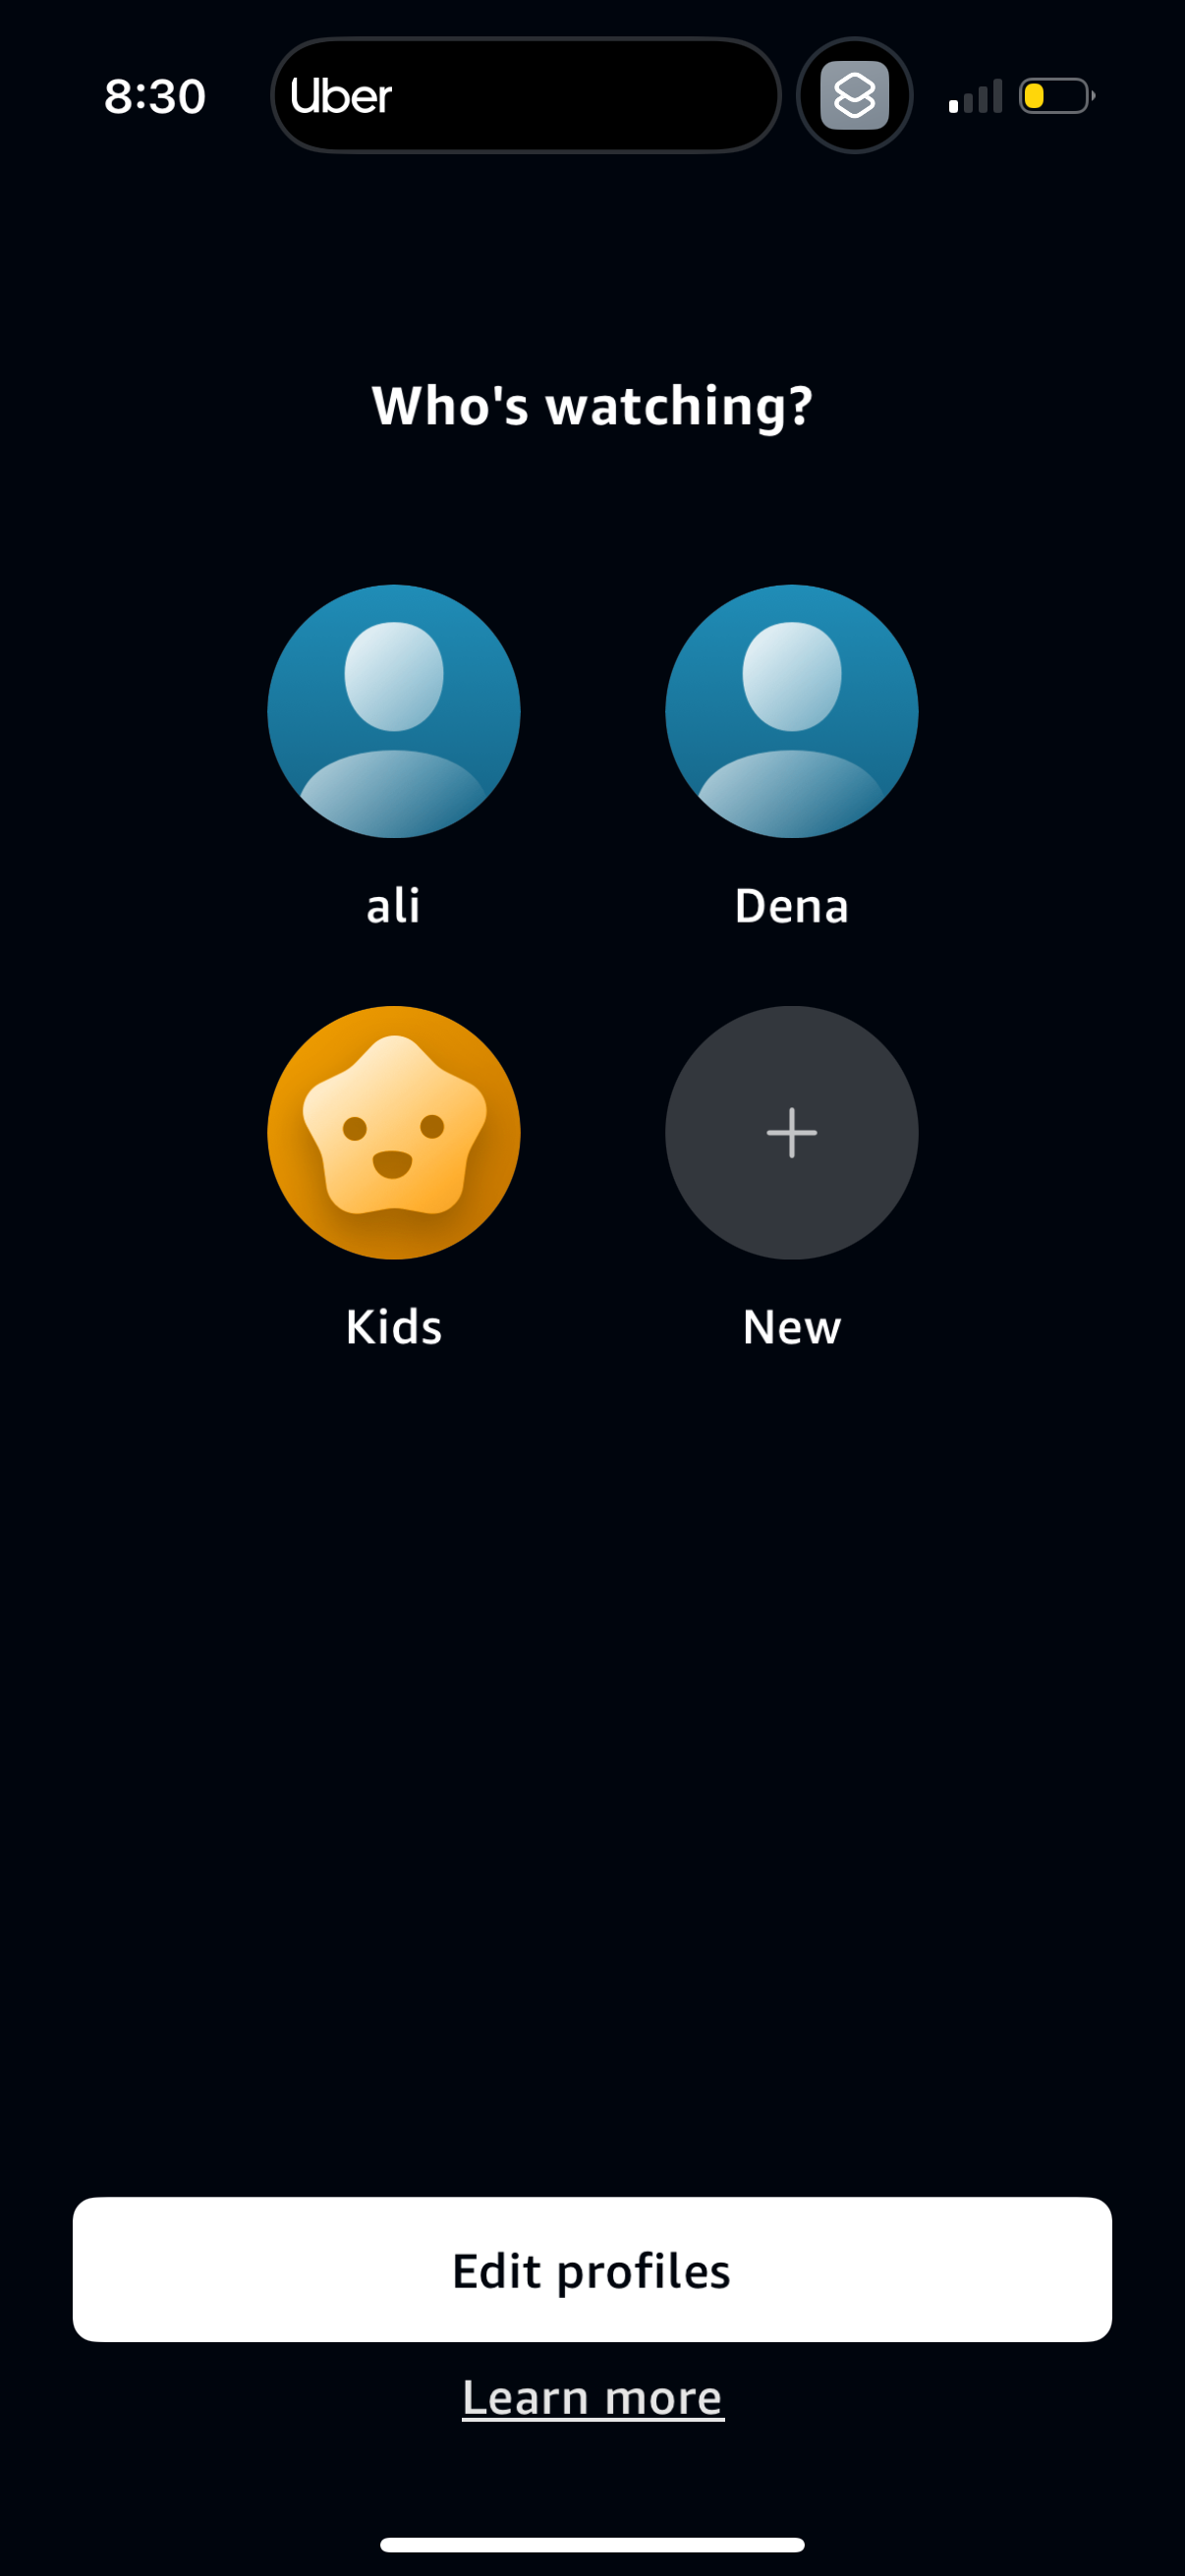
16.6% of tracked apps (134 of 809) have a captured biometric or passkey login surface — Face ID, Touch ID, fingerprint, or passkey [1]. So biometric login is a minority pattern, roughly 1 in 6 tracked apps, concentrated where security or fast re-entry matters most. It is expected in finance and password managers, optional almost everywhere else.
134 of ~800 tracked apps (16.6%) have biometric or passkey login — Lazyweb Research, July 2026.
| Item | % |
|---|---|
| Dark mode toggle | 19.0% |
| Biometric / passkey login | 16.6% |
| Onboarding quiz | 13.3% |
The finding
134 of 809 apps (16.6%) surface biometric/passkey login [1]. It sits in the low-prevalence tier alongside dark-mode toggles (19.0%) and onboarding quizzes (13.3%) [2].
| Pattern | Apps | % |
|---|---|---|
| Dark mode toggle | 154 | 19.0% |
| Biometric / passkey login | 134 | 16.6% |
| Onboarding quiz | 108 | 13.3% |
How to apply it
Biometric login earns its place where re-authentication friction and security both matter — finance, health, and anything holding sensitive data. If that's you, biometrics are worth the build even though only ~1 in 6 tracked apps have one [1]. For low-stakes consumer apps, a persistent session is usually enough, and biometrics can add friction without a clear payoff.
Caveats
Lower bound — reflects only biometric screens Lazyweb captured [1]. The match spans Face ID, Touch ID, fingerprint, biometric, and passkey terms, deduped by company. Biometric prompts are often OS-level and may not appear as a distinct captured screen, so real adoption likely exceeds 16.6%.
The numbers
| Stat | Computed from |
|---|---|
| 16.6% (134 of 809) | prevalence_biometric_login: 134/809 |
| Dark mode 19.0% (154), Biometric 16.6% (134), Onboarding quiz 13.3% (108) | prevalence_dark_mode, prevalence_biometric_login, prevalence_onboarding_quiz |
Sources & citations
- [1] Lazyweb Research analysis of 809 mobile apps (809 mobile apps with >=1 captured screen; 751 with tag data; median 41 screens/app), July 2026. Prevalence = COUNT(DISTINCT company_name) over LLM synonym tags; denominator is 809 tracked apps (reported conservatively over all apps-with-screens, not the 62,376-row companies table). Lower bound: only reflects screens Lazyweb captured (median 41/app). ↩
Source: Lazyweb Research — proprietary analysis of real, in-market app screens. Cite as Lazyweb Research, 2026-07-07.
Explore the evidence
Related questions
More in Mobile screen-pattern prevalence censuses (does everyone have X screen?) →