What percent of mobile apps have an in-flow upsell or order-bump surface?
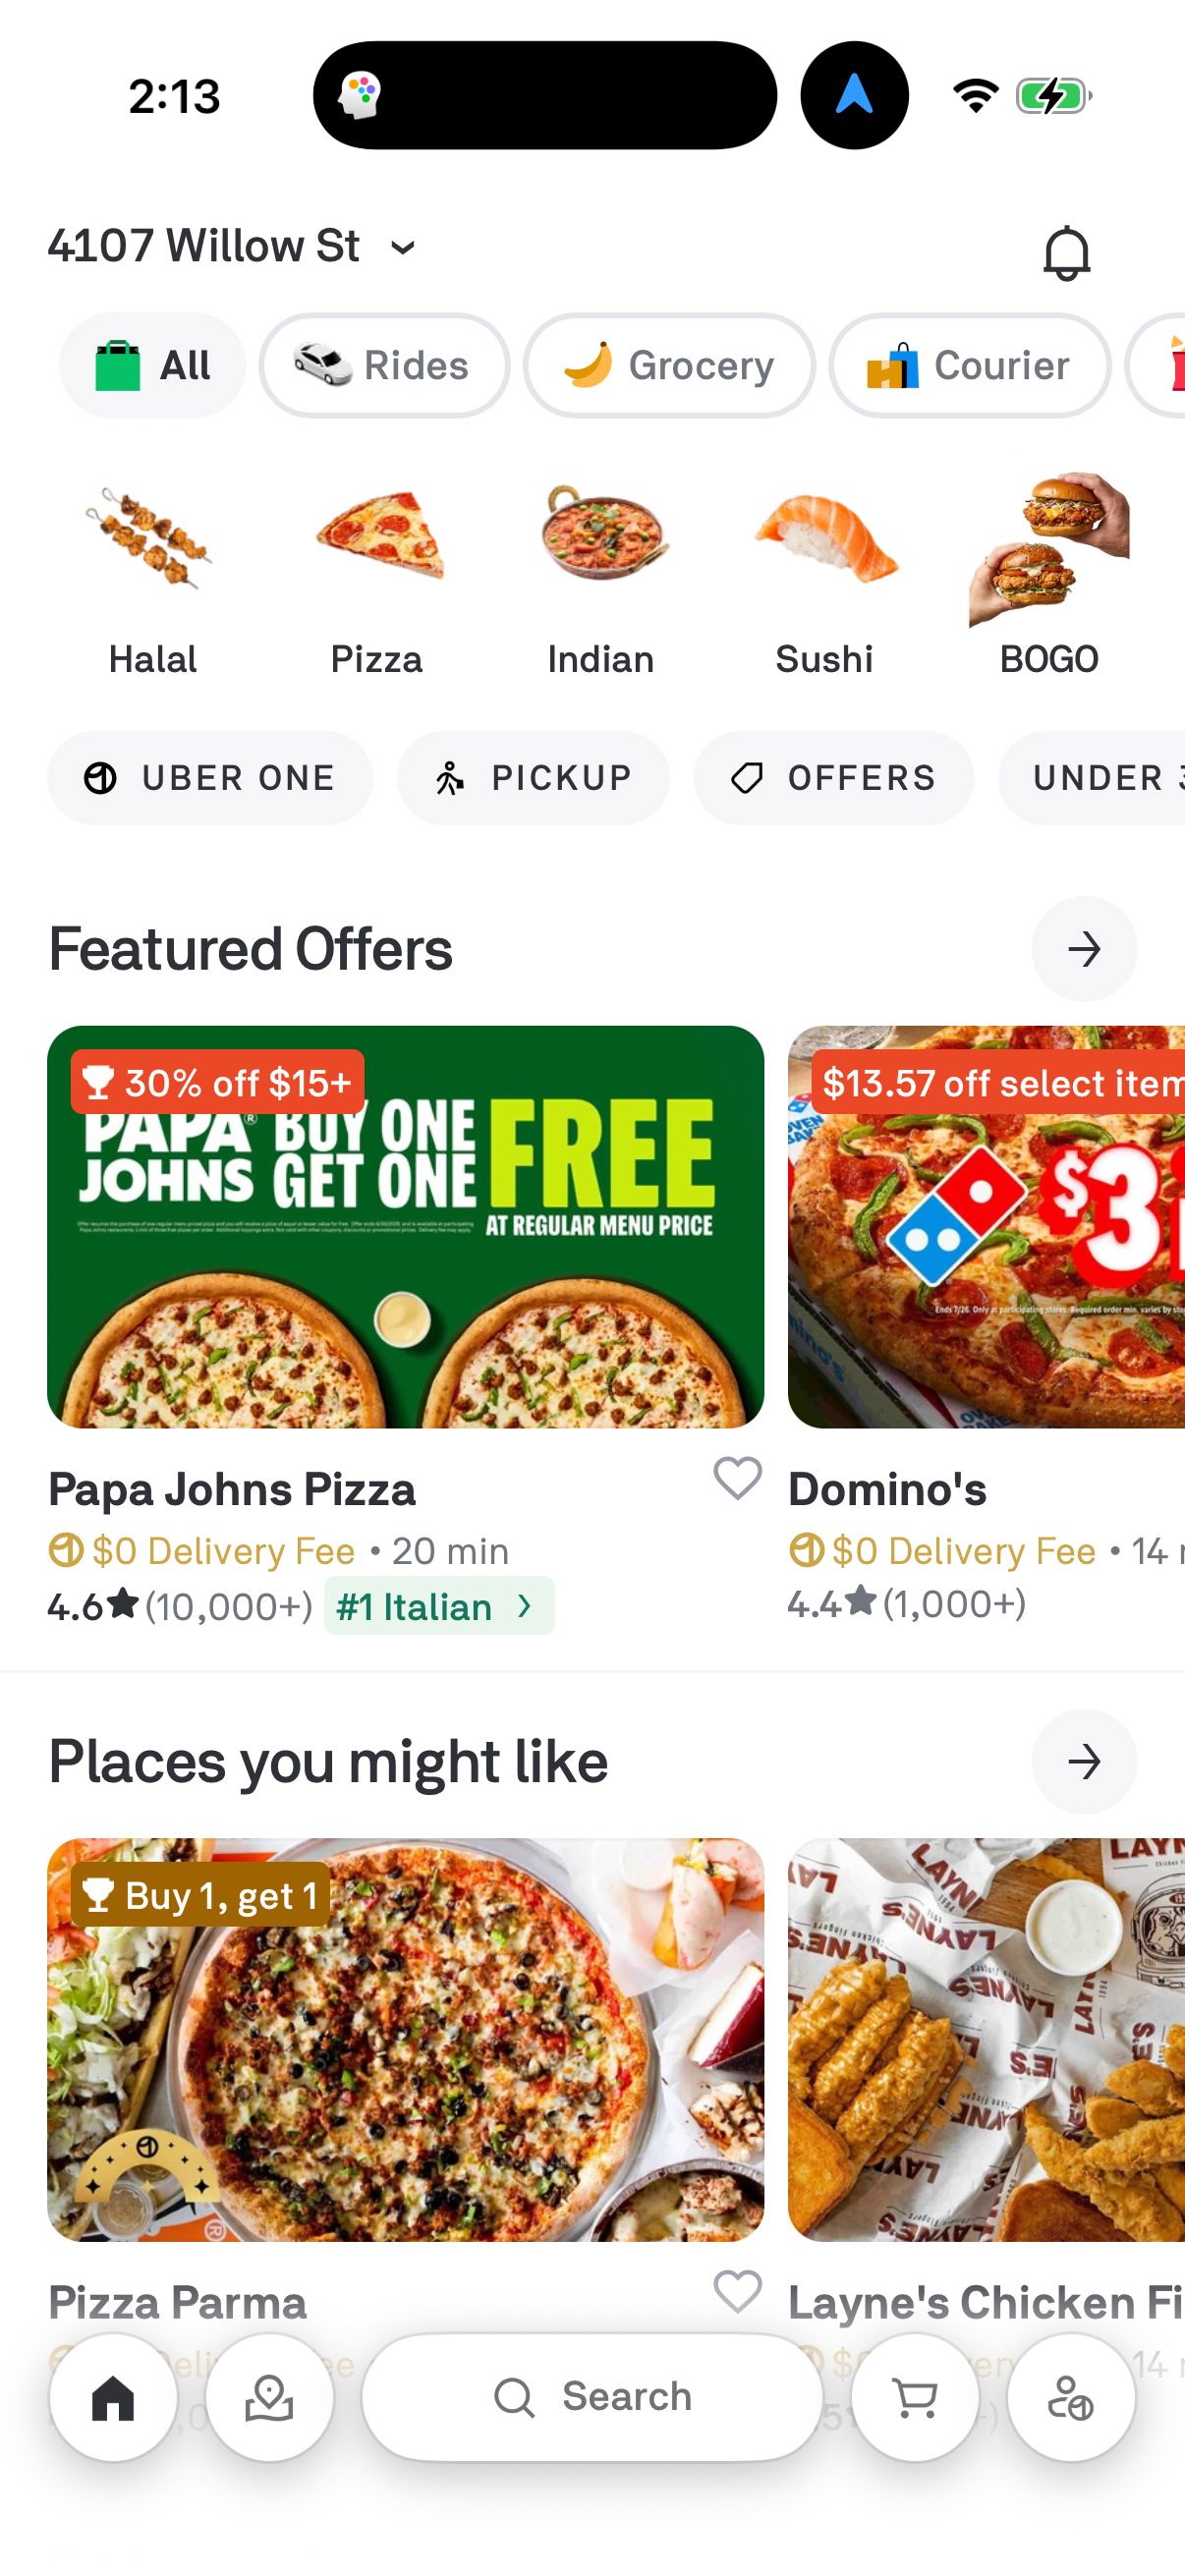
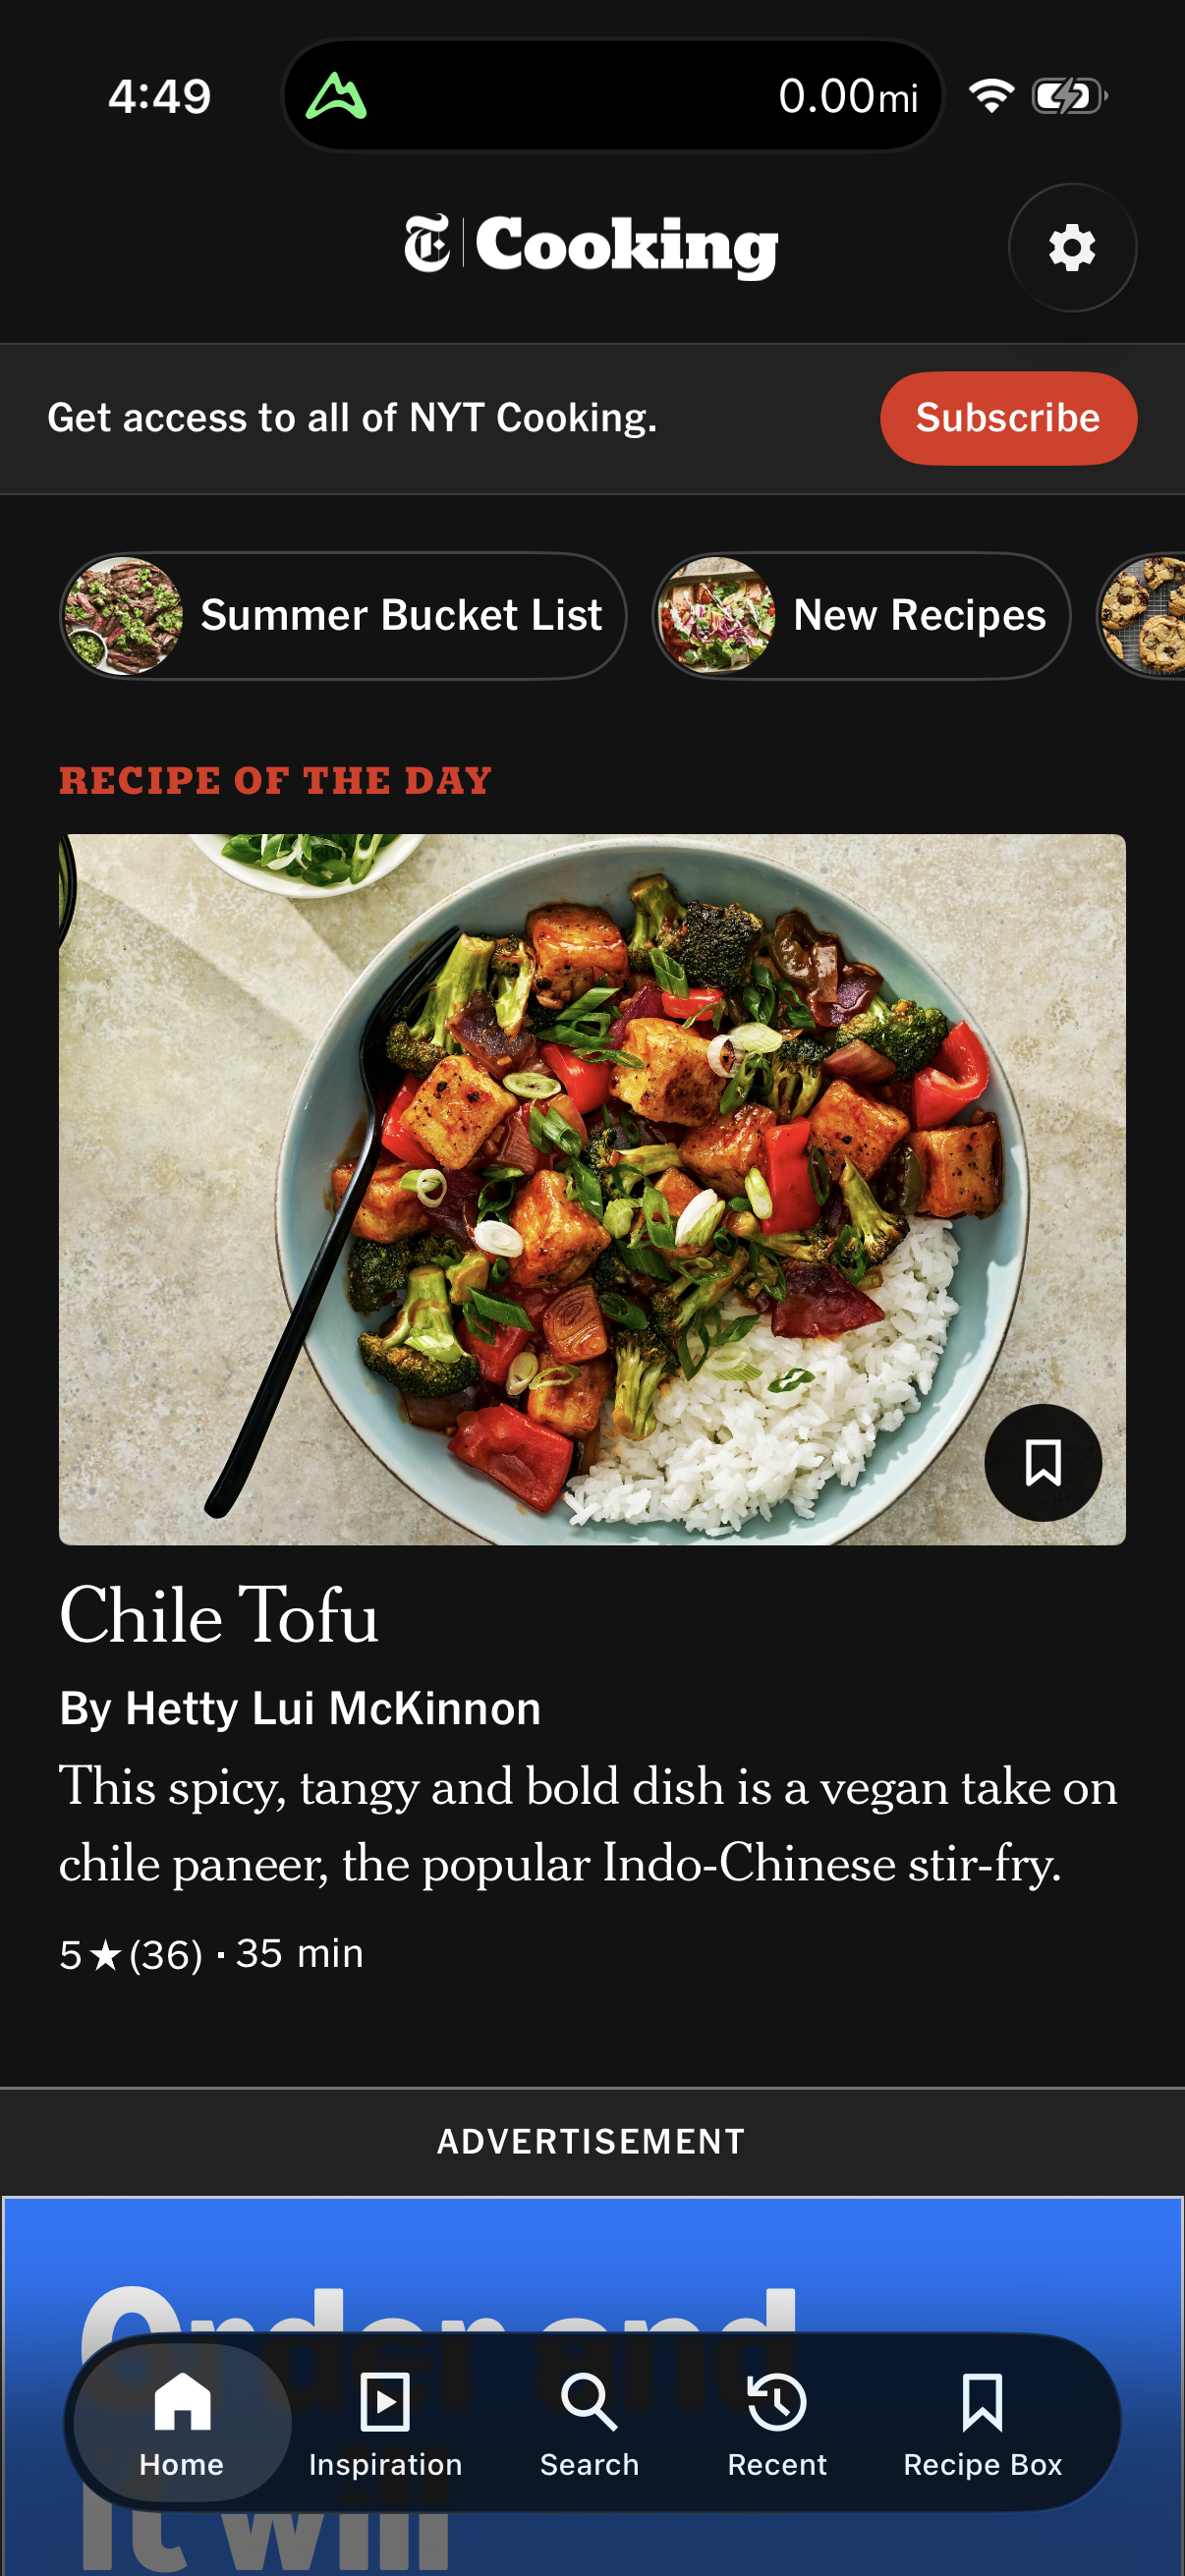
At most 46.2% of tracked apps (374 of 809) show an in-flow upsell or order-bump surface — but this is a deliberate upper bound [1]. The tag match catches both checkout order-bumps and subscription upsells, so read 46.2% as 'has any in-flow upsell' rather than pure checkout order-bump. Even at the ceiling, that leaves over half of tracked apps with no captured in-flow upsell.
Up to 374 of ~800 tracked apps (46.2%, upper bound) show an in-flow upsell — Lazyweb Research, July 2026.


| Item | % |
|---|---|
| In-flow upsell (broad) | 46.2% |
| Paywall | 37.7% |
| Checkout / cart | 33.4% |
The finding
374 of 809 apps (46.2%) match an upsell / order-bump / add-to-order tag [1]. This is explicitly an upper bound: the broad '%upsell%' match also catches subscription upsells, so the true rate of pure checkout order-bumps is lower. Bracketed by the two clean monetization surfaces [2]:
| Surface | Apps | % | Note |
|---|---|---|---|
| In-flow upsell (broad) | 374 | 46.2% | upper bound |
| Paywall | 305 | 37.7% | clean |
| Checkout / cart | 270 | 33.4% | clean |
How to apply it
Treat 46.2% as the ceiling for 'do apps add an upsell in the flow?' — the real order-bump-at-checkout rate sits below it, closer to the checkout-having population of 33% [1]. If you run commerce checkout, an order bump is a common and low-risk add. If you run subscriptions, the 'upsell' you should benchmark is a plan-upgrade or add-on offer on the paywall, which this figure also folds in.
Caveats
This is the pack's flagged upper-bound stat: '%upsell%' over-matches by catching subscription upsells alongside checkout order-bumps, so do not present 46.2% as a pure checkout-upsell rate [1]. Lower bound on capture still applies. Deduped by company.
The numbers
| Stat | Computed from |
|---|---|
| 46.2% (374 of 809), upper bound | prevalence_checkout_upsell: 374/809 (broad, upper bound) |
| Paywall 37.7% (305), Checkout/cart 33.4% (270) | prevalence_paywall_screen, prevalence_checkout_cart |
Sources & citations
- [1] Lazyweb Research analysis of 809 mobile apps (809 mobile apps with >=1 captured screen; 751 with tag data; median 41 screens/app), July 2026. Prevalence = COUNT(DISTINCT company_name) over LLM synonym tags; denominator is 809 tracked apps (reported conservatively over all apps-with-screens, not the 62,376-row companies table). Lower bound: only reflects screens Lazyweb captured (median 41/app). ↩
Source: Lazyweb Research — proprietary analysis of real, in-market app screens. Cite as Lazyweb Research, 2026-07-07.
Explore the evidence
Related questions
More in Mobile screen-pattern prevalence censuses (does everyone have X screen?) →