Which app categories lead hardest with free trials on their paywalls?
Trial-led framing varies almost 3x by category. Among verticals with enough data, Magazines & Newspapers (50.0%), Books (47.0%) and Music (46.1%) lead; Graphics & Design (15.6%) trails far behind [1][2][3][4]. The all-app average is 33.7% of primary CTAs mentioning a free trial [5]. Price-in-button moves inversely — the trial-light categories are the price-forward ones.
Trial-led paywall CTAs range from 50.0% (Magazines) to 15.6% (Graphics & Design) — vs a 33.7% average — July 2026.
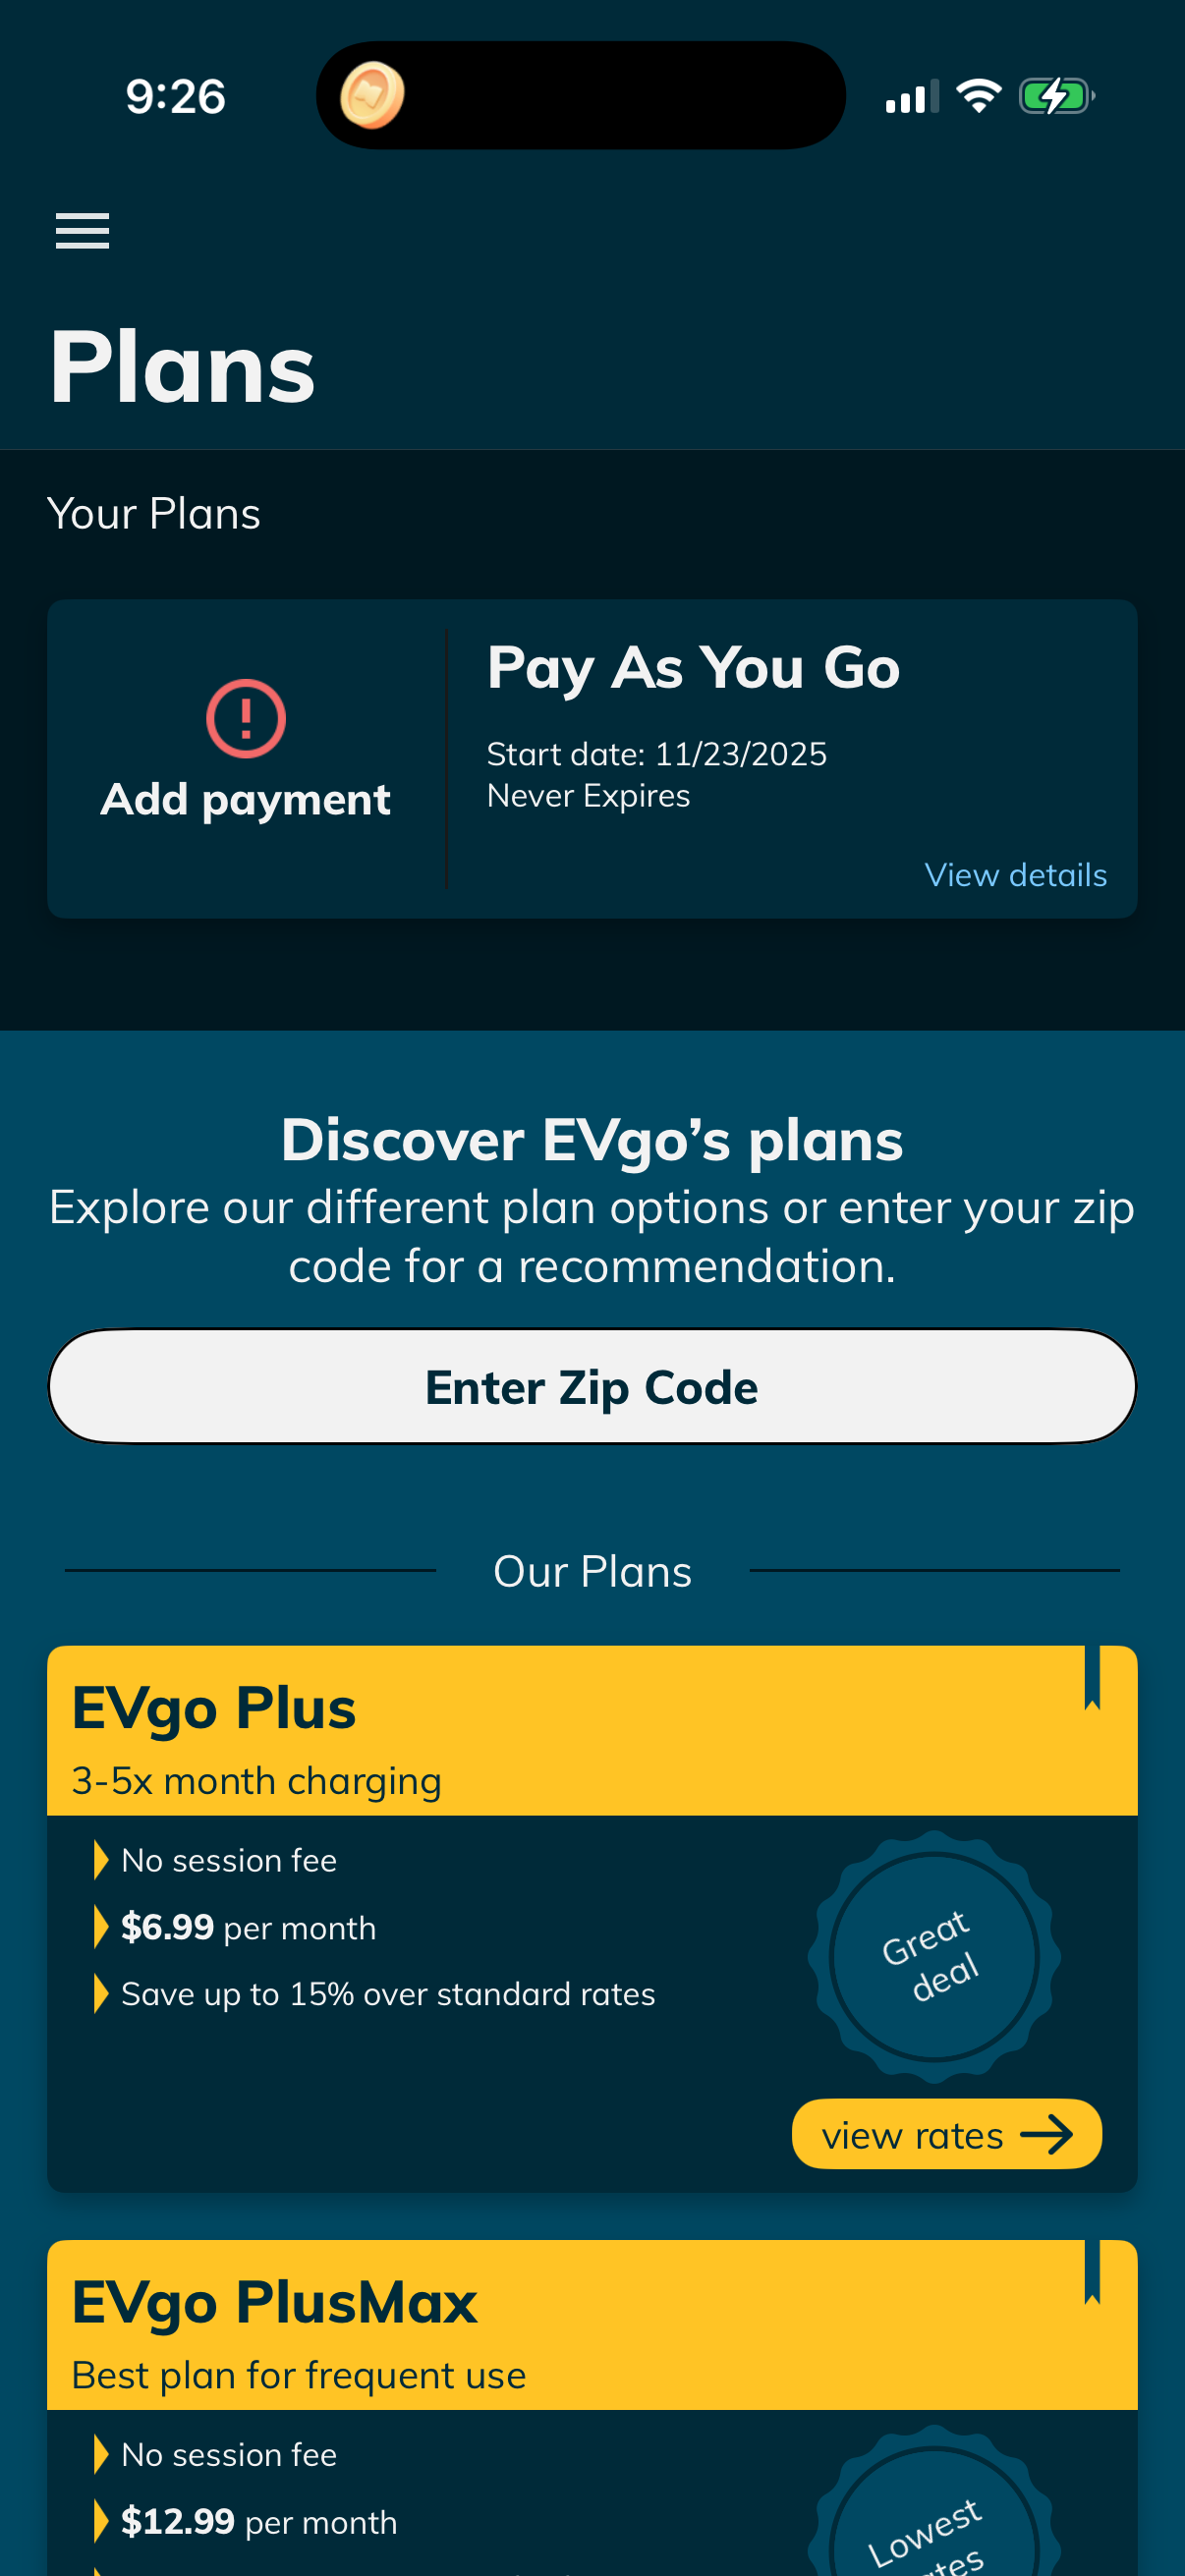
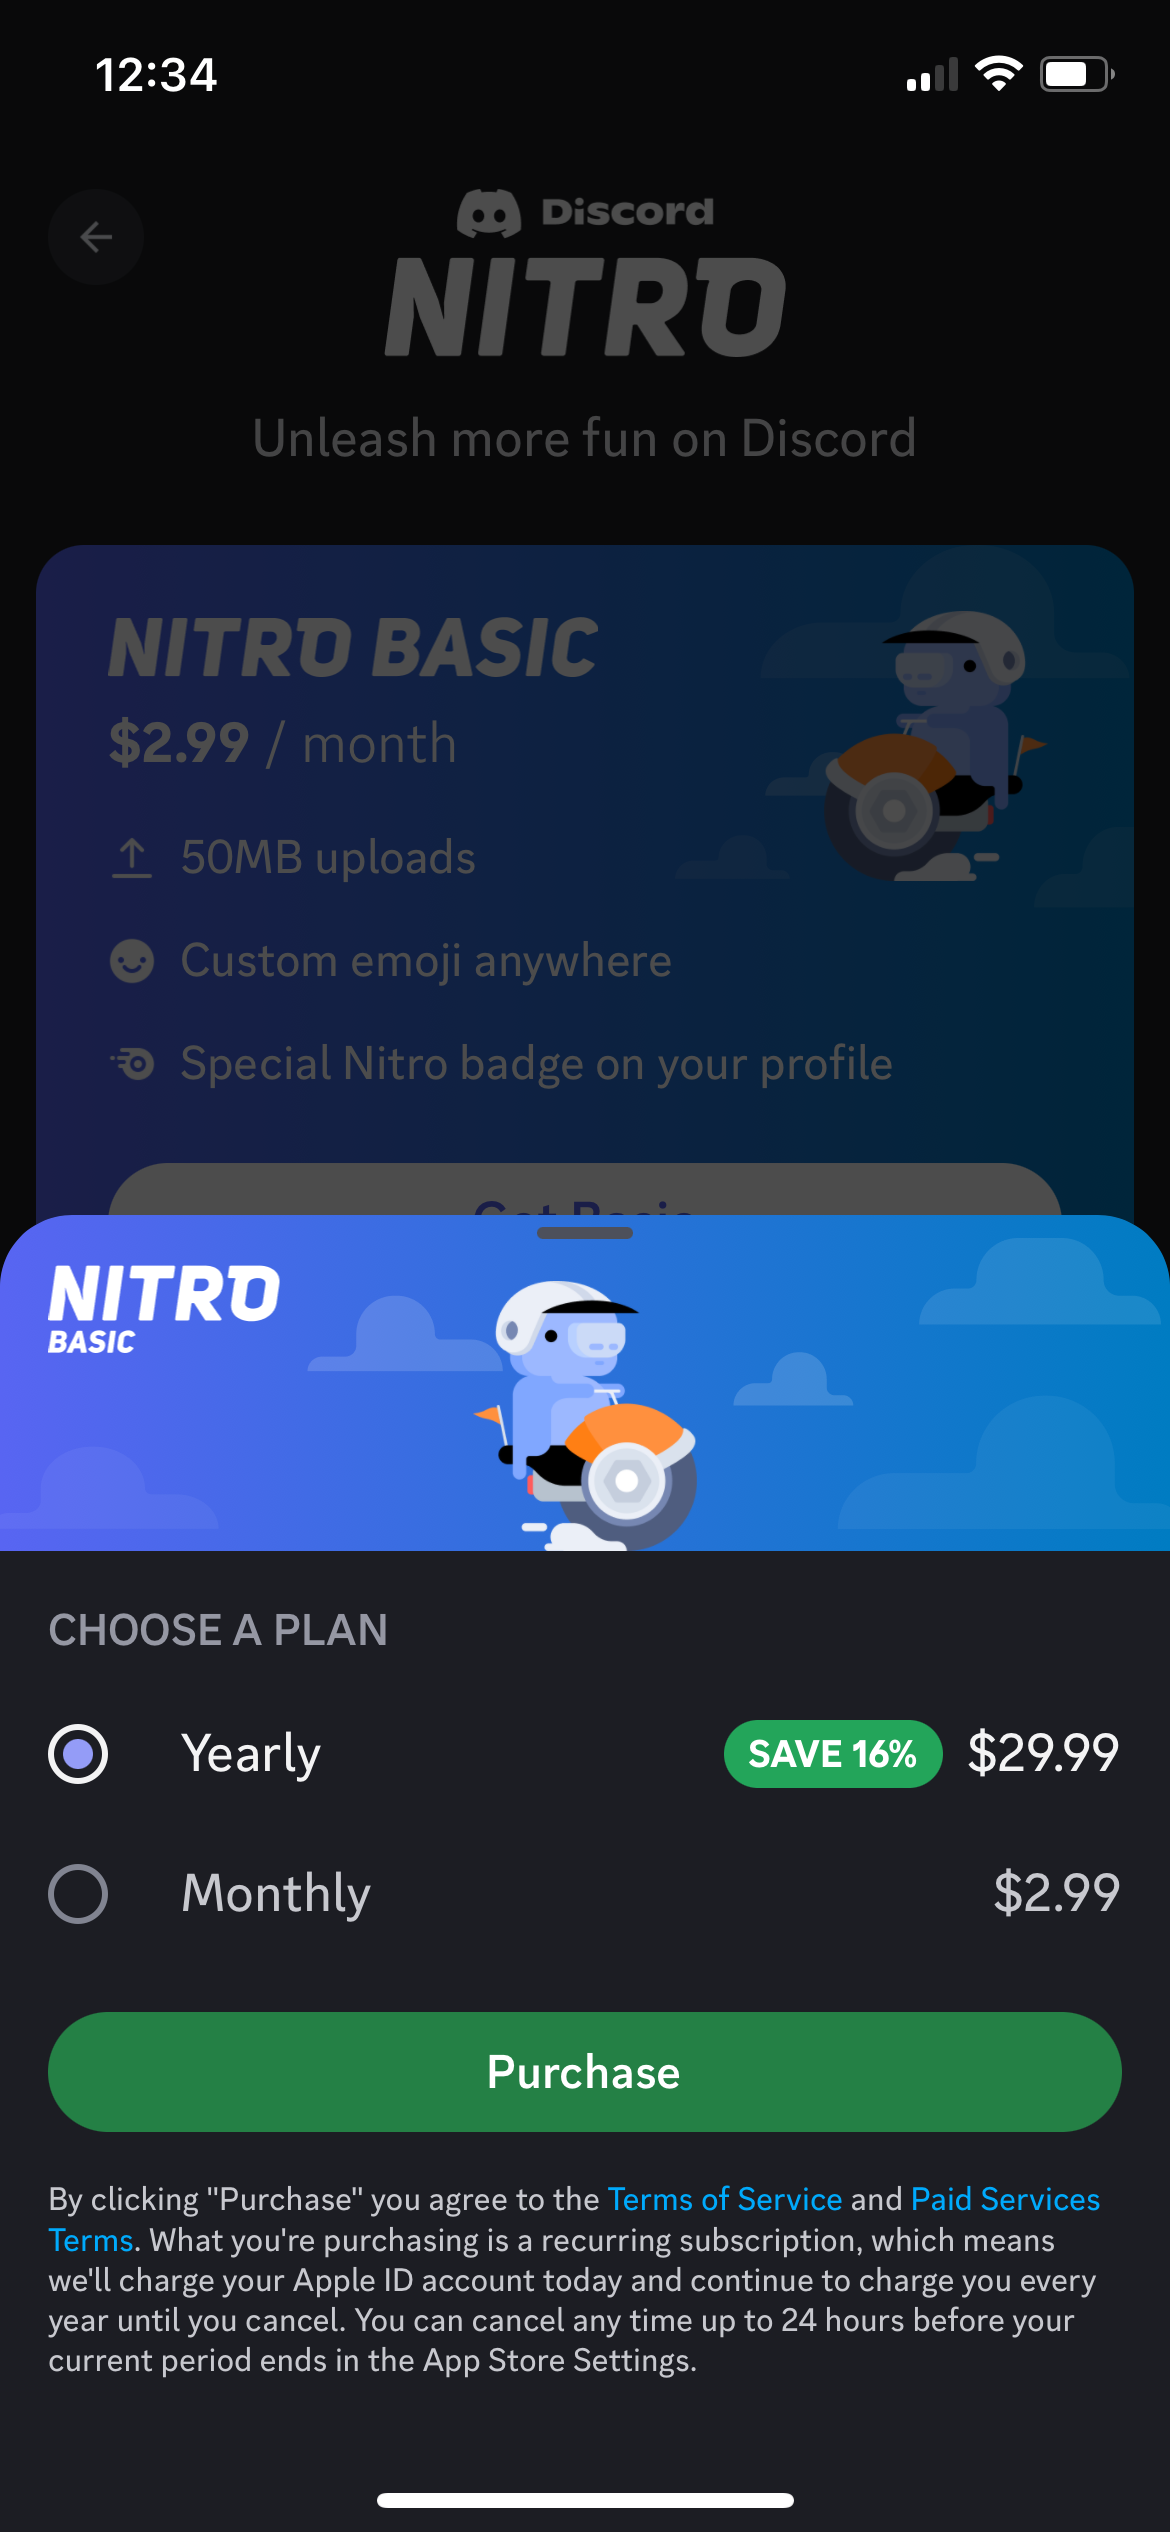
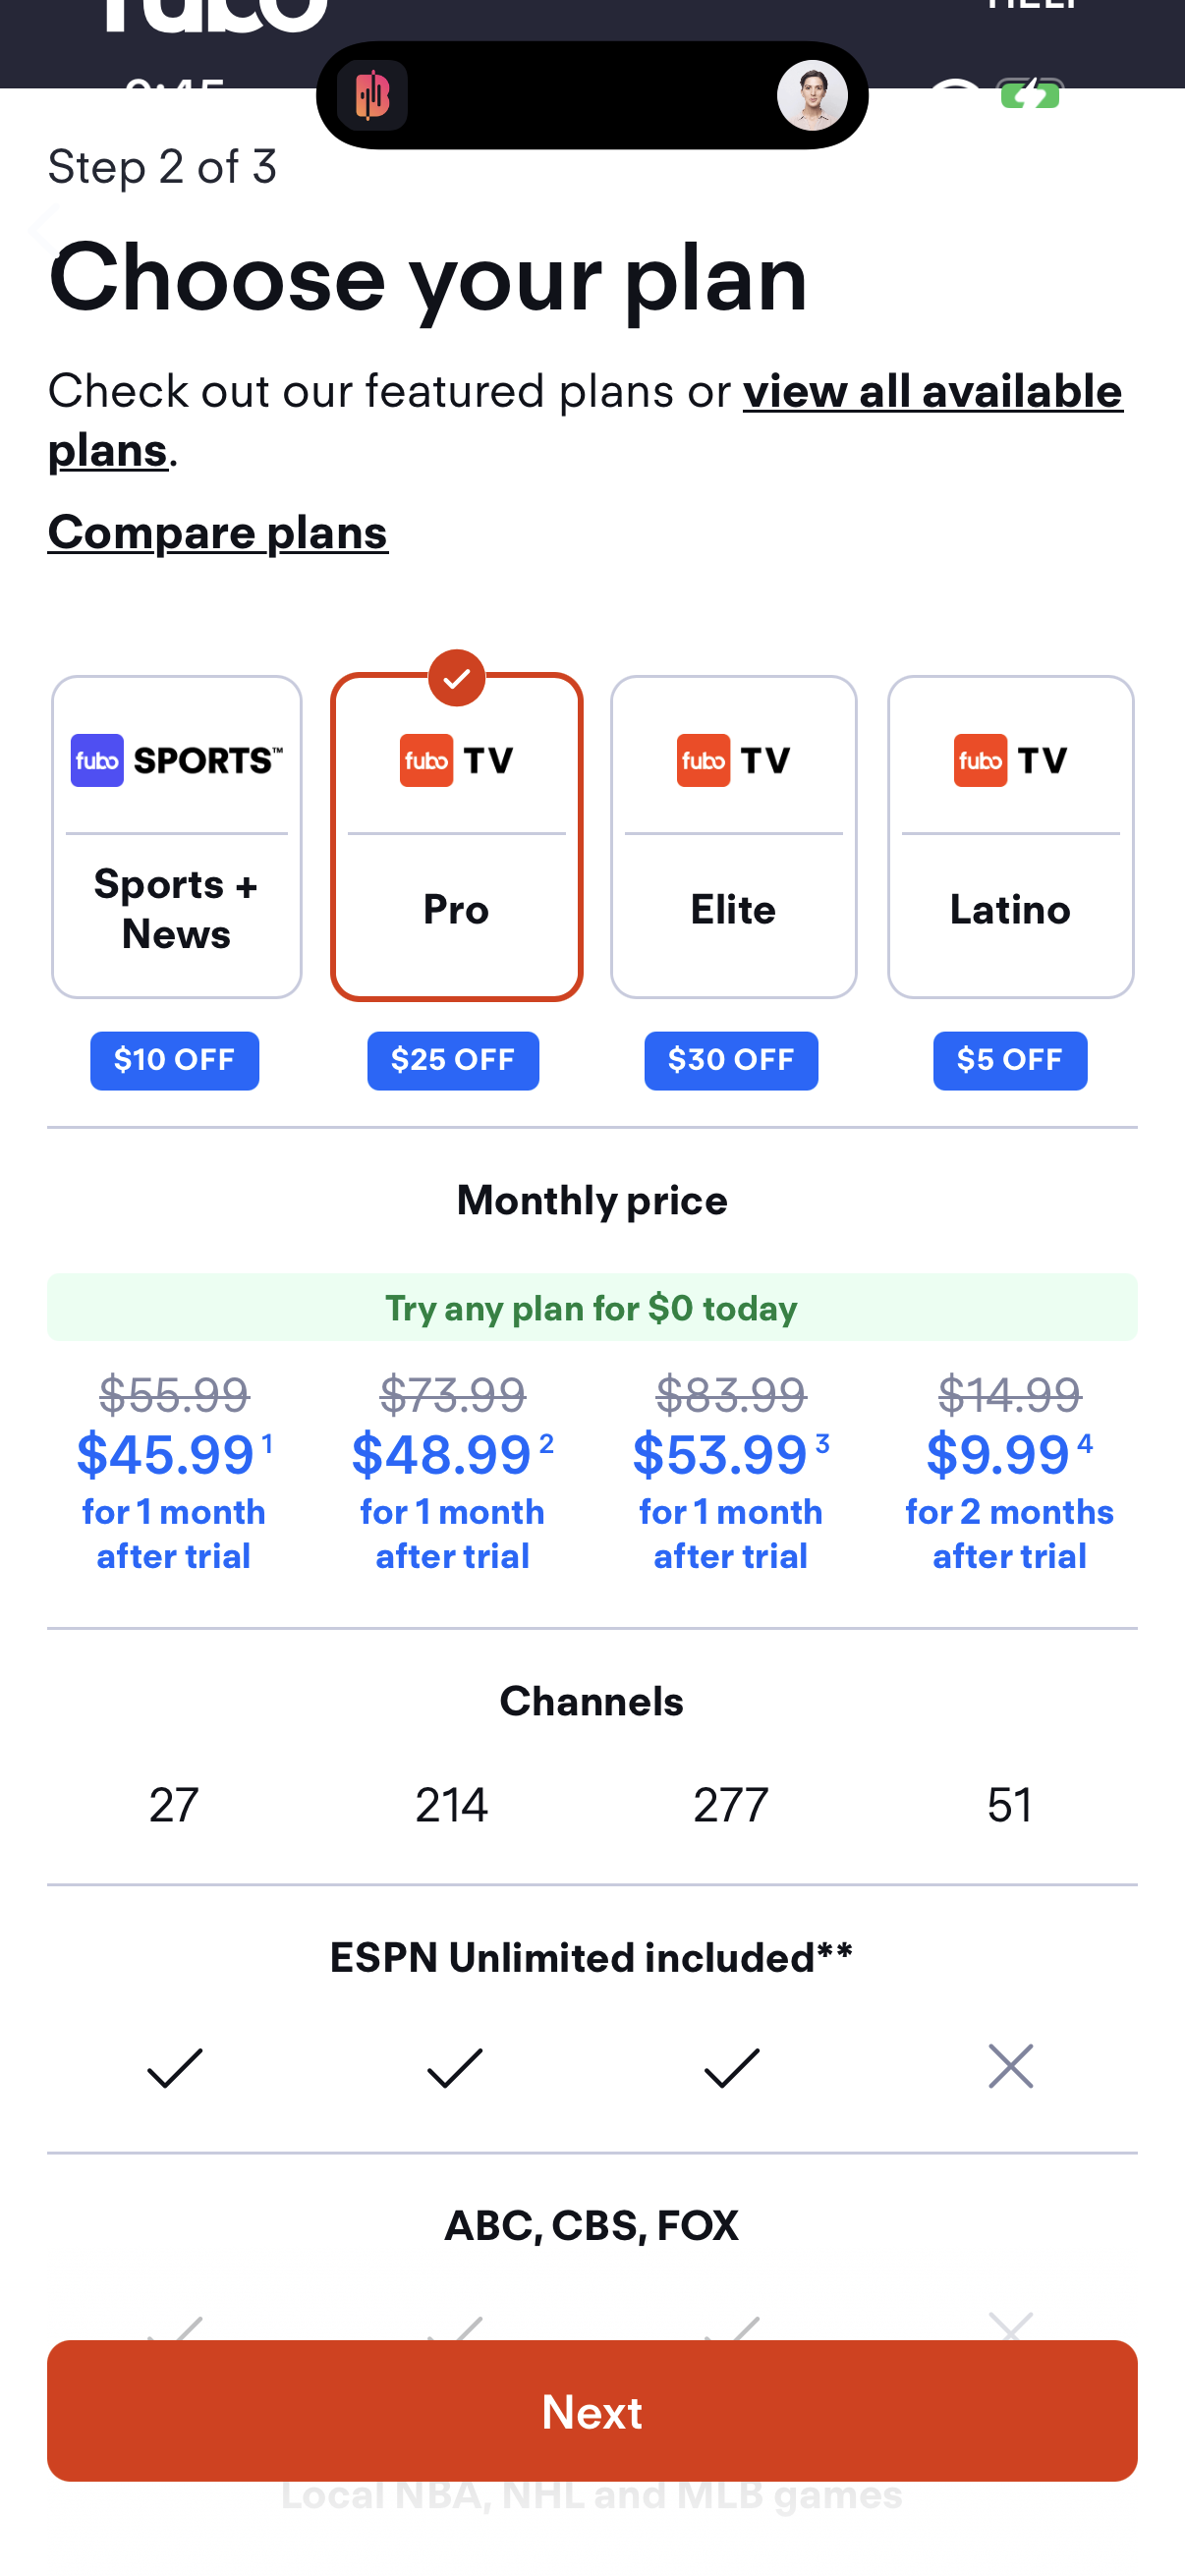

| Item | Trial-led % |
|---|---|
| Magazines & Newspapers | 50.0% |
| Books | 47.0% |
| Music | 46.1% |
| Health & Fitness | 38.5% |
| Education | 37.9% |
| Productivity | 24.0% |
| Photo & Video | 23.9% |
| Graphics & Design | 15.6% |
| **All apps** | **33.7%** |
The finding: category sets the norm
Verticals with n≥70 primary CTAs, ranked by trial-led share:
| Category | Trial-led % | Price-in-CTA % | n (primary CTAs) |
|---|---|---|---|
| Magazines & Newspapers | 50.0% | 20.8% | 72 [1] |
| Books | 47.0% | 4.8% | 83 [2] |
| Music | 46.1% | 2.3% | 128 [3] |
| Health & Fitness | 38.5% | 3.8% | 340 [6] |
| Education | 37.9% | 9.0% | 443 [7] |
| Productivity | 24.0% | 5.3% | 75 [8] |
| Photo & Video | 23.9% | 10.3% | 155 [9] |
| Graphics & Design | 15.6% | 25.0% | 96 [4] |
| All apps | 33.7% | 11.6% | 1,886 [5] |
Magazines, Books and Music cluster at the top; Graphics & Design sits less than a third as trial-led [1][2][3][4].
Trial-led and price-in-button trade off
The categories that lean hardest on free trials tend to keep price *out* of the button: Music (46.1% trial-led / 2.3% price) and Books (47.0% / 4.8%) [3][2]. The trial-light categories flip it — Graphics & Design is the least trial-led (15.6%) and the most price-forward (25.0% price-in-button), and Magazines is high on both (50.0% / 20.8%), the one exception [4][1]. As a rule: subscription-media and habit categories sell the free window; tool/creative categories sell the price and unlock.
How to apply this
Benchmark against your *own* category, not the 33.7% global average — the norm swings from 15.6% to 50.0% [4][1]. If you're in Books, Music or a media/subscription category, a strongly trial-led paywall with the price above (not in) the button is on-pattern [2][3]. If you're in a creative/tools category like Graphics & Design, a price-forward paywall is the norm and a heavy trial lean would be the differentiating experiment [4]. Use the inverse relationship deliberately: leading with a trial usually means moving the price out of the button, and vice versa [3][4].
Caveats
Only categories with n≥70 primary CTAs get percentages; News (n=47), Medical and Travel fall below the bar and are excluded [10]. Category is a company-level join, so all of a company's CTAs land in one vertical. Trial-led is a keyword match on button text; price-in-button uses a currency/decimal regex; primary-role CTAs only (39% unknown-role excluded) [11]. Graphics & Design's high price-in-button (25.0%) is a real signal but on a modest n=96 [4].
The numbers
| Stat | Computed from |
|---|---|
| Magazines & Newspapers: 50.0% trial-led, 20.8% price-in-CTA (n=72) | trial_led_by_category_other_n70: Magazines 50.0%/20.8%, n=72 |
| Books: 47.0% trial-led, 4.8% price-in-CTA (n=83) | trial_led_by_category_other_n70: Books 47.0%/4.8%, n=83 |
| Music: 46.1% trial-led, 2.3% price-in-CTA (n=128) | trial_led_by_category_music |
| Graphics & Design: 15.6% trial-led, 25.0% price-in-CTA (n=96) | trial_led_by_category_other_n70: Graphics & Design 15.6%/25.0%, n=96 |
| All-app: 33.7% trial-led, 11.6% price-in-CTA (n=1,886) | trial_led_primary_share 33.7%; price_in_cta_share 11.6% |
| Health & Fitness: 38.5% trial-led, 3.8% price-in-CTA (n=340) | trial_led_by_category_health_fitness |
| Education: 37.9% trial-led, 9.0% price-in-CTA (n=443) | trial_led_by_category_education |
| Productivity: 24.0% trial-led, 5.3% price-in-CTA (n=75) | trial_led_by_category_other_n70: Productivity 24.0%/5.3%, n=75 |
| Photo & Video: 23.9% trial-led, 10.3% price-in-CTA (n=155) | trial_led_by_category_photo_video |
| News n=47 and others below n=70 excluded from % cuts | smallSampleWarnings; trial_led_by_category_other_n70 News note |
| 39% CTA rows role='unknown', excluded | universe note |
Sources & citations
- [1] Lazyweb Research analysis of 1,886 primary paywall CTAs (~800 tracked apps), July 2026. Per-vertical trial-led and price-in-CTA shares via company-level category join; only categories with n>=70 shown. ↩
- [2] Lazyweb Research analysis of ~800 tracked apps by category, July 2026. Categories below n=70 (News, Medical, Travel) excluded from percentage cuts. ↩
Source: Lazyweb Research — proprietary analysis of real, in-market app screens. Cite as Lazyweb Research, 2026-07-07.
Explore the evidence
Related questions
More in Free-trial framing and reassurance copy on paywalls →