Do Photo & Video apps lead with a free trial or a price on their paywalls?
Photo & Video apps are the least trial-led of the big verticals and the most price-forward: only 23.9% of 155 primary CTAs mention a free trial, while 10.3% put a price in the button — close to the 11.6% baseline [1][2]. Trial-length mentions are too sparse here to break down (7 total across all lengths) [3]. Net: this category anchors on price more than most.
Only 23.9% of 155 Photo & Video primary CTAs lead with a trial — the lowest of the named verticals — July 2026.
| Item | Photo & Video |
|---|---|
| Trial-led primary CTAs | 23.9% (37) |
| Price inside the button | 10.3% (16) |
| Any trial-length mention | 7 |
The finding: price-forward, trial-light
Across 155 Photo & Video primary CTAs (15 companies) [1]:
| Metric | Photo & Video | All-app baseline |
|---|---|---|
| Trial-led primary CTAs | 23.9% (37) | 33.7% [4] |
| Price inside the button | 10.3% (16) | 11.6% [5] |
| Any trial-length mention | 7 | — [3] |
Trial-led framing sits ~10 points below the all-app norm, and price-in-button is essentially at baseline — the opposite tilt from Health & Fitness [1][2]. Photo/video buyers appear to be sold on the price and feature unlock more than on a free window.
How to read the price tilt
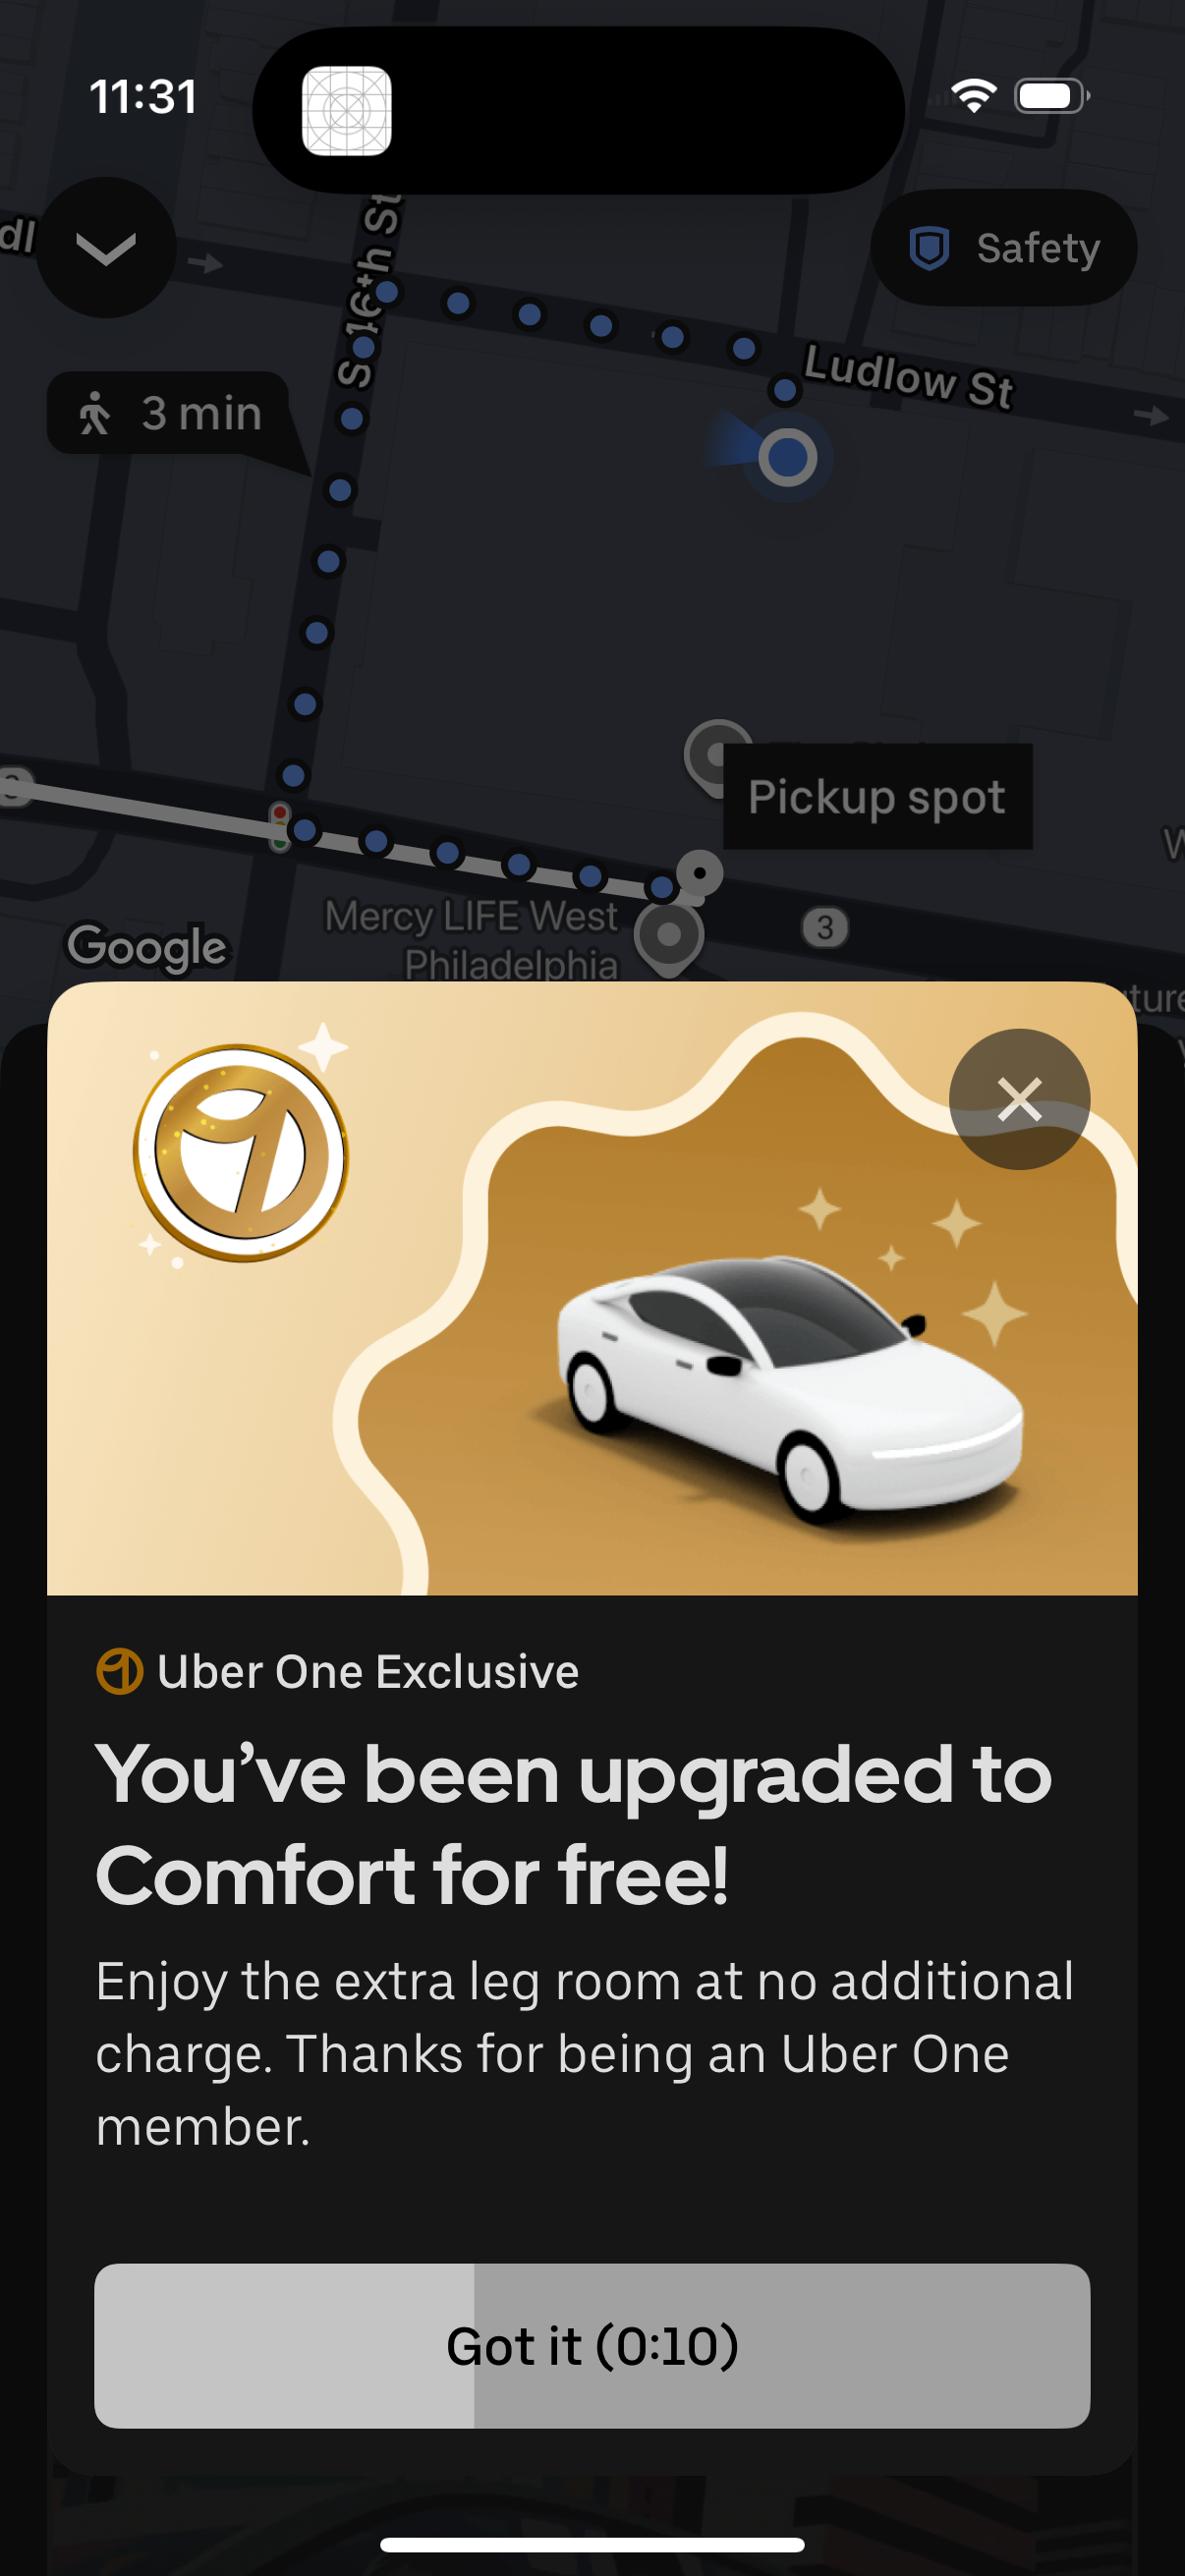
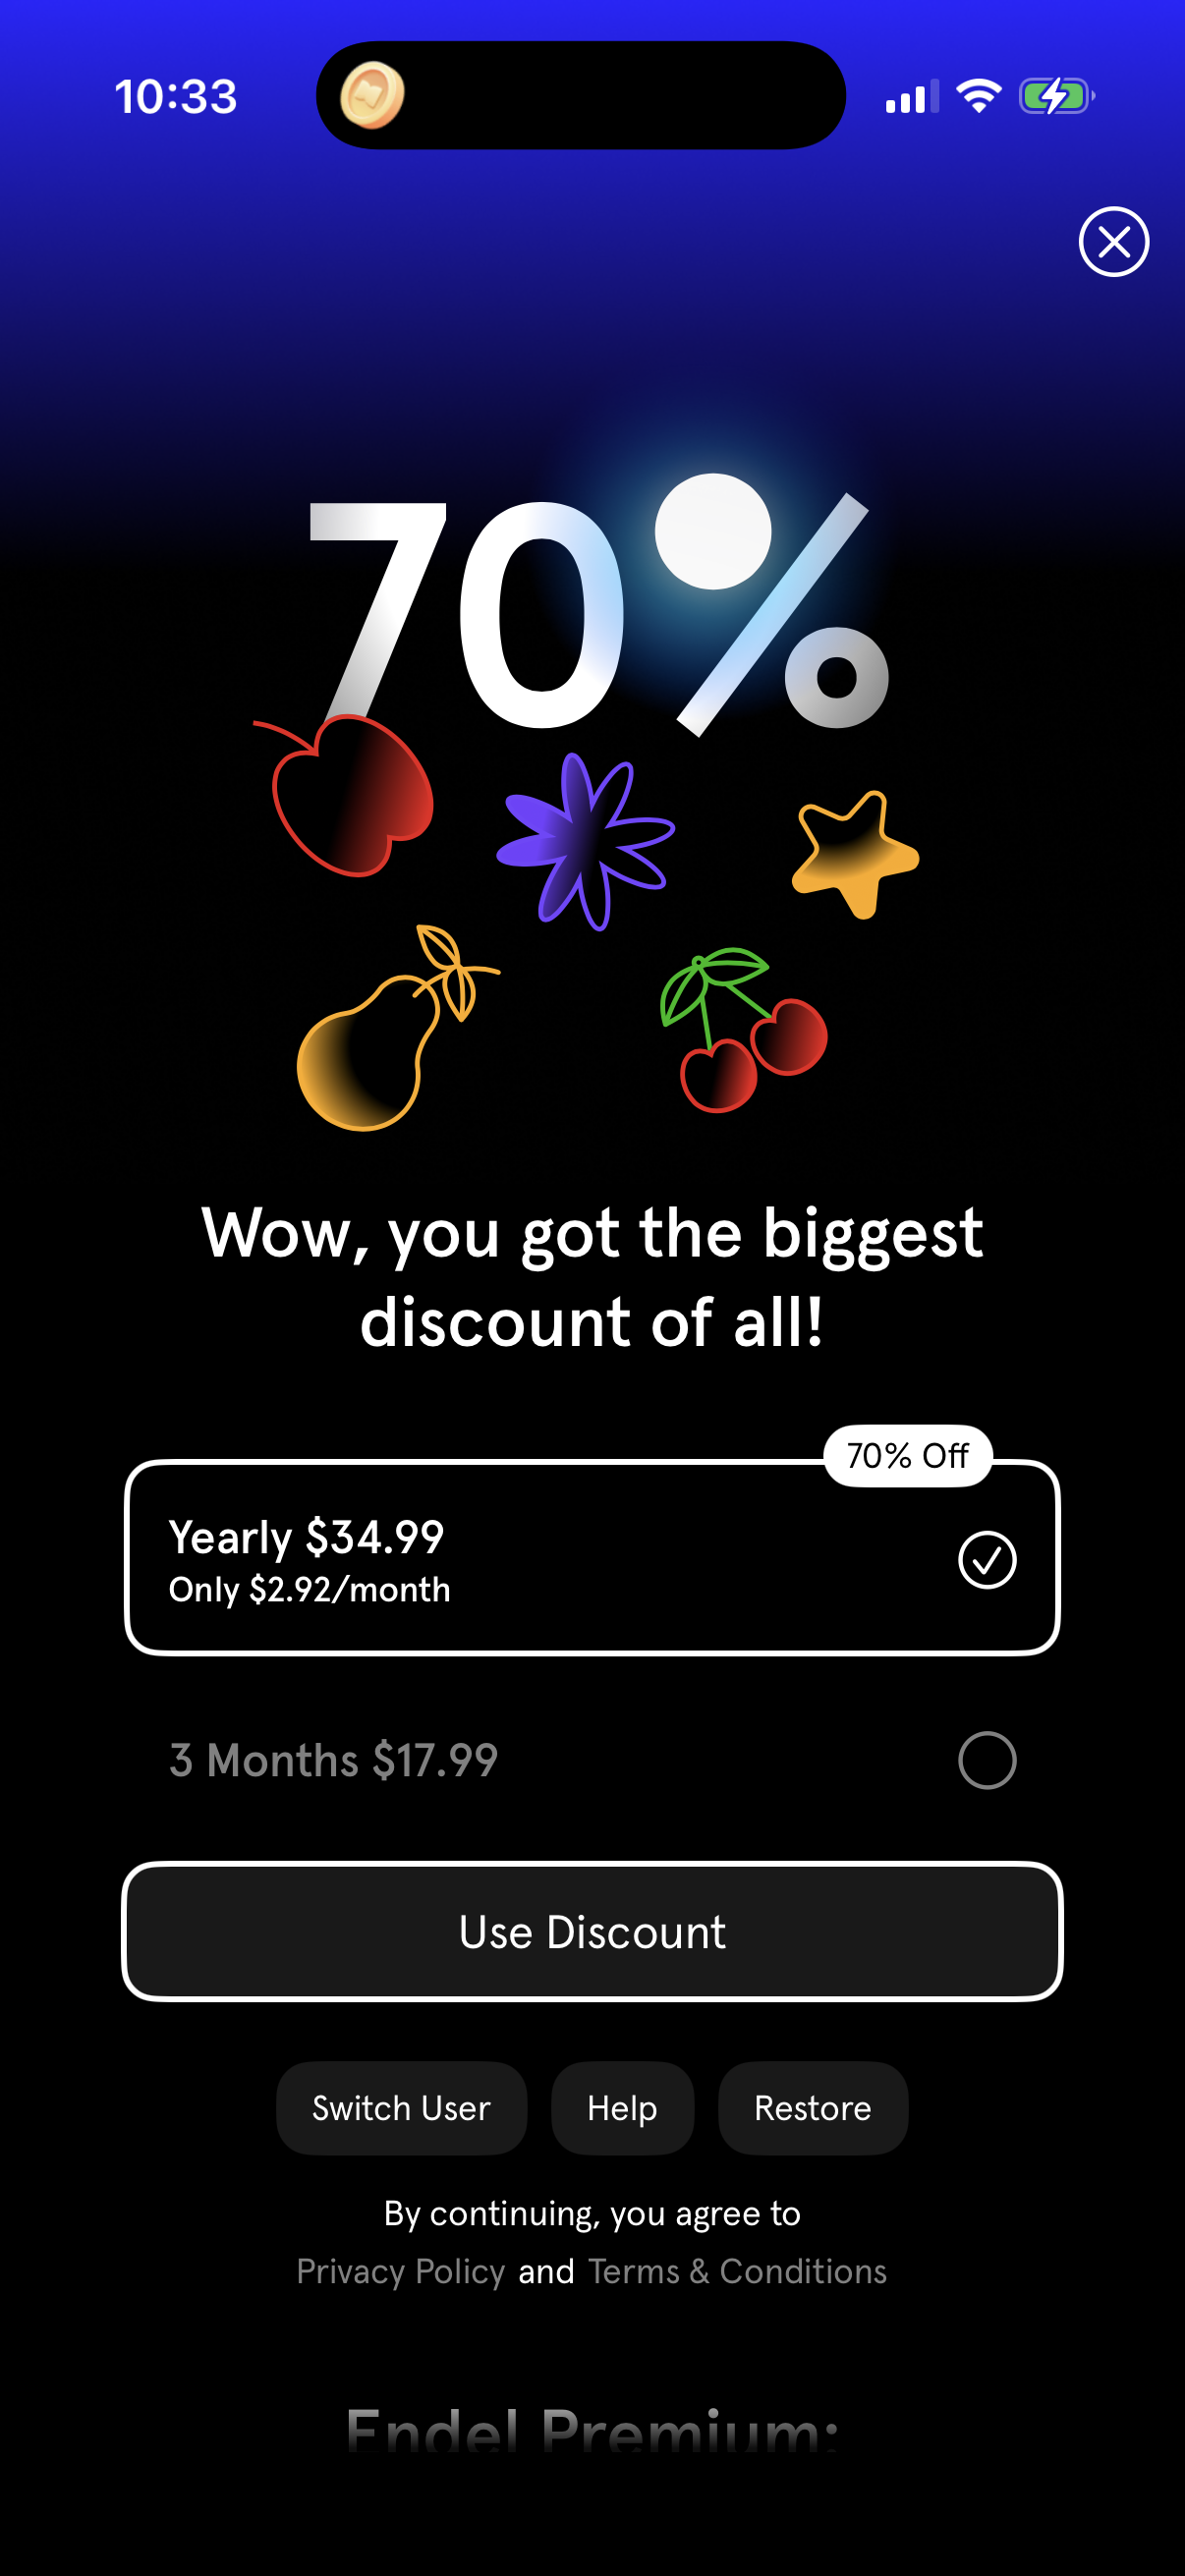
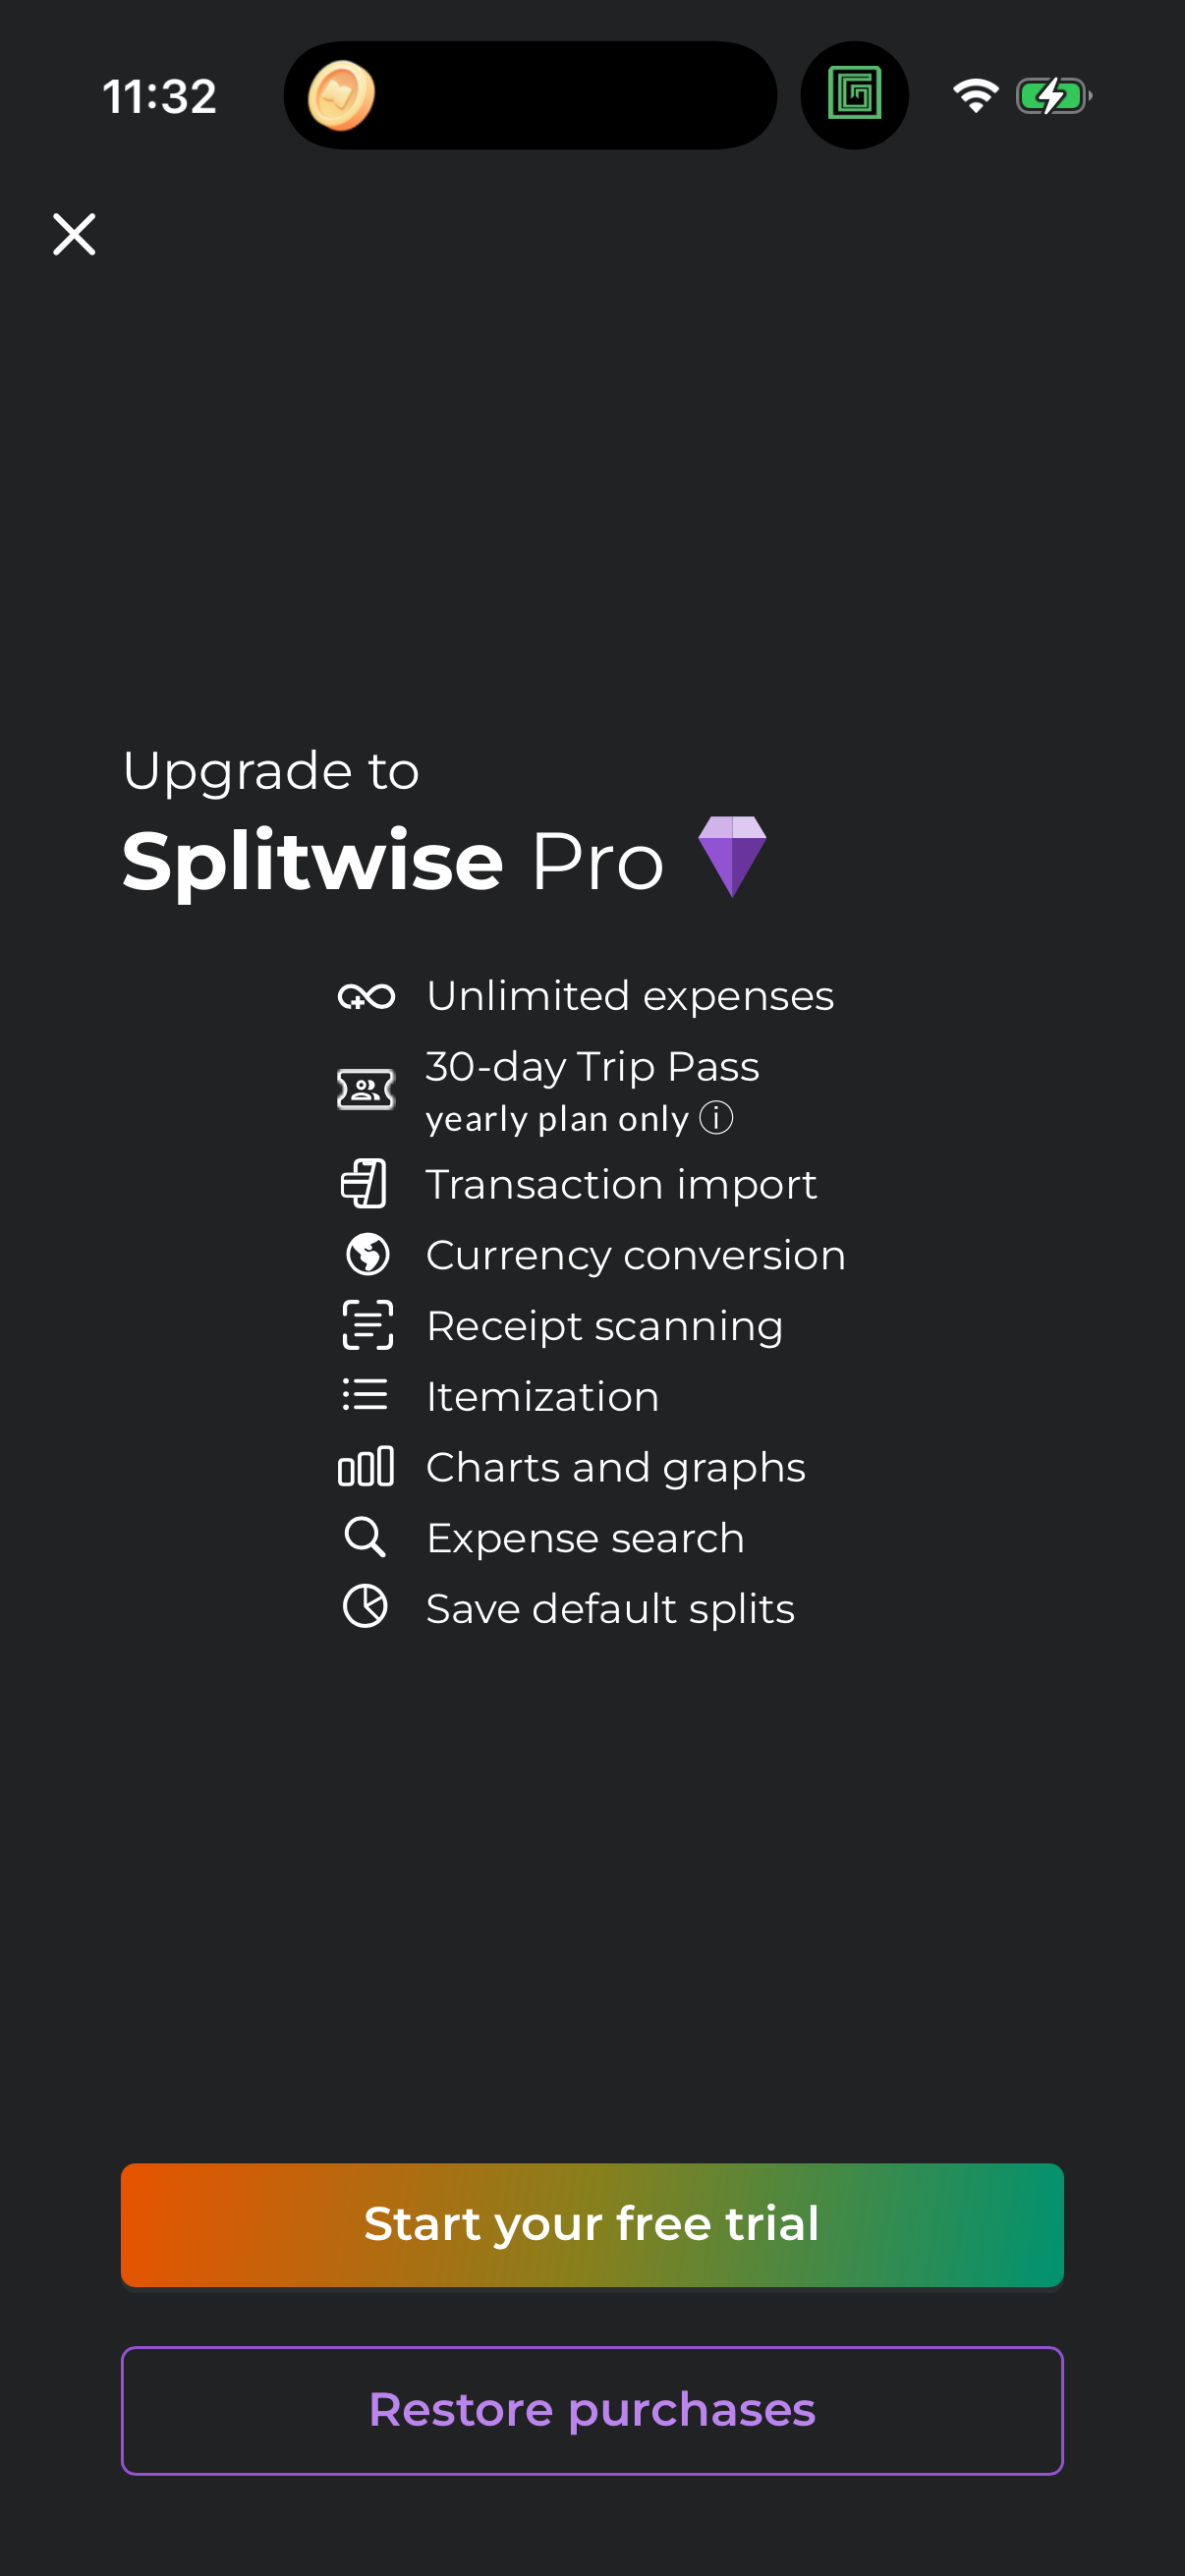
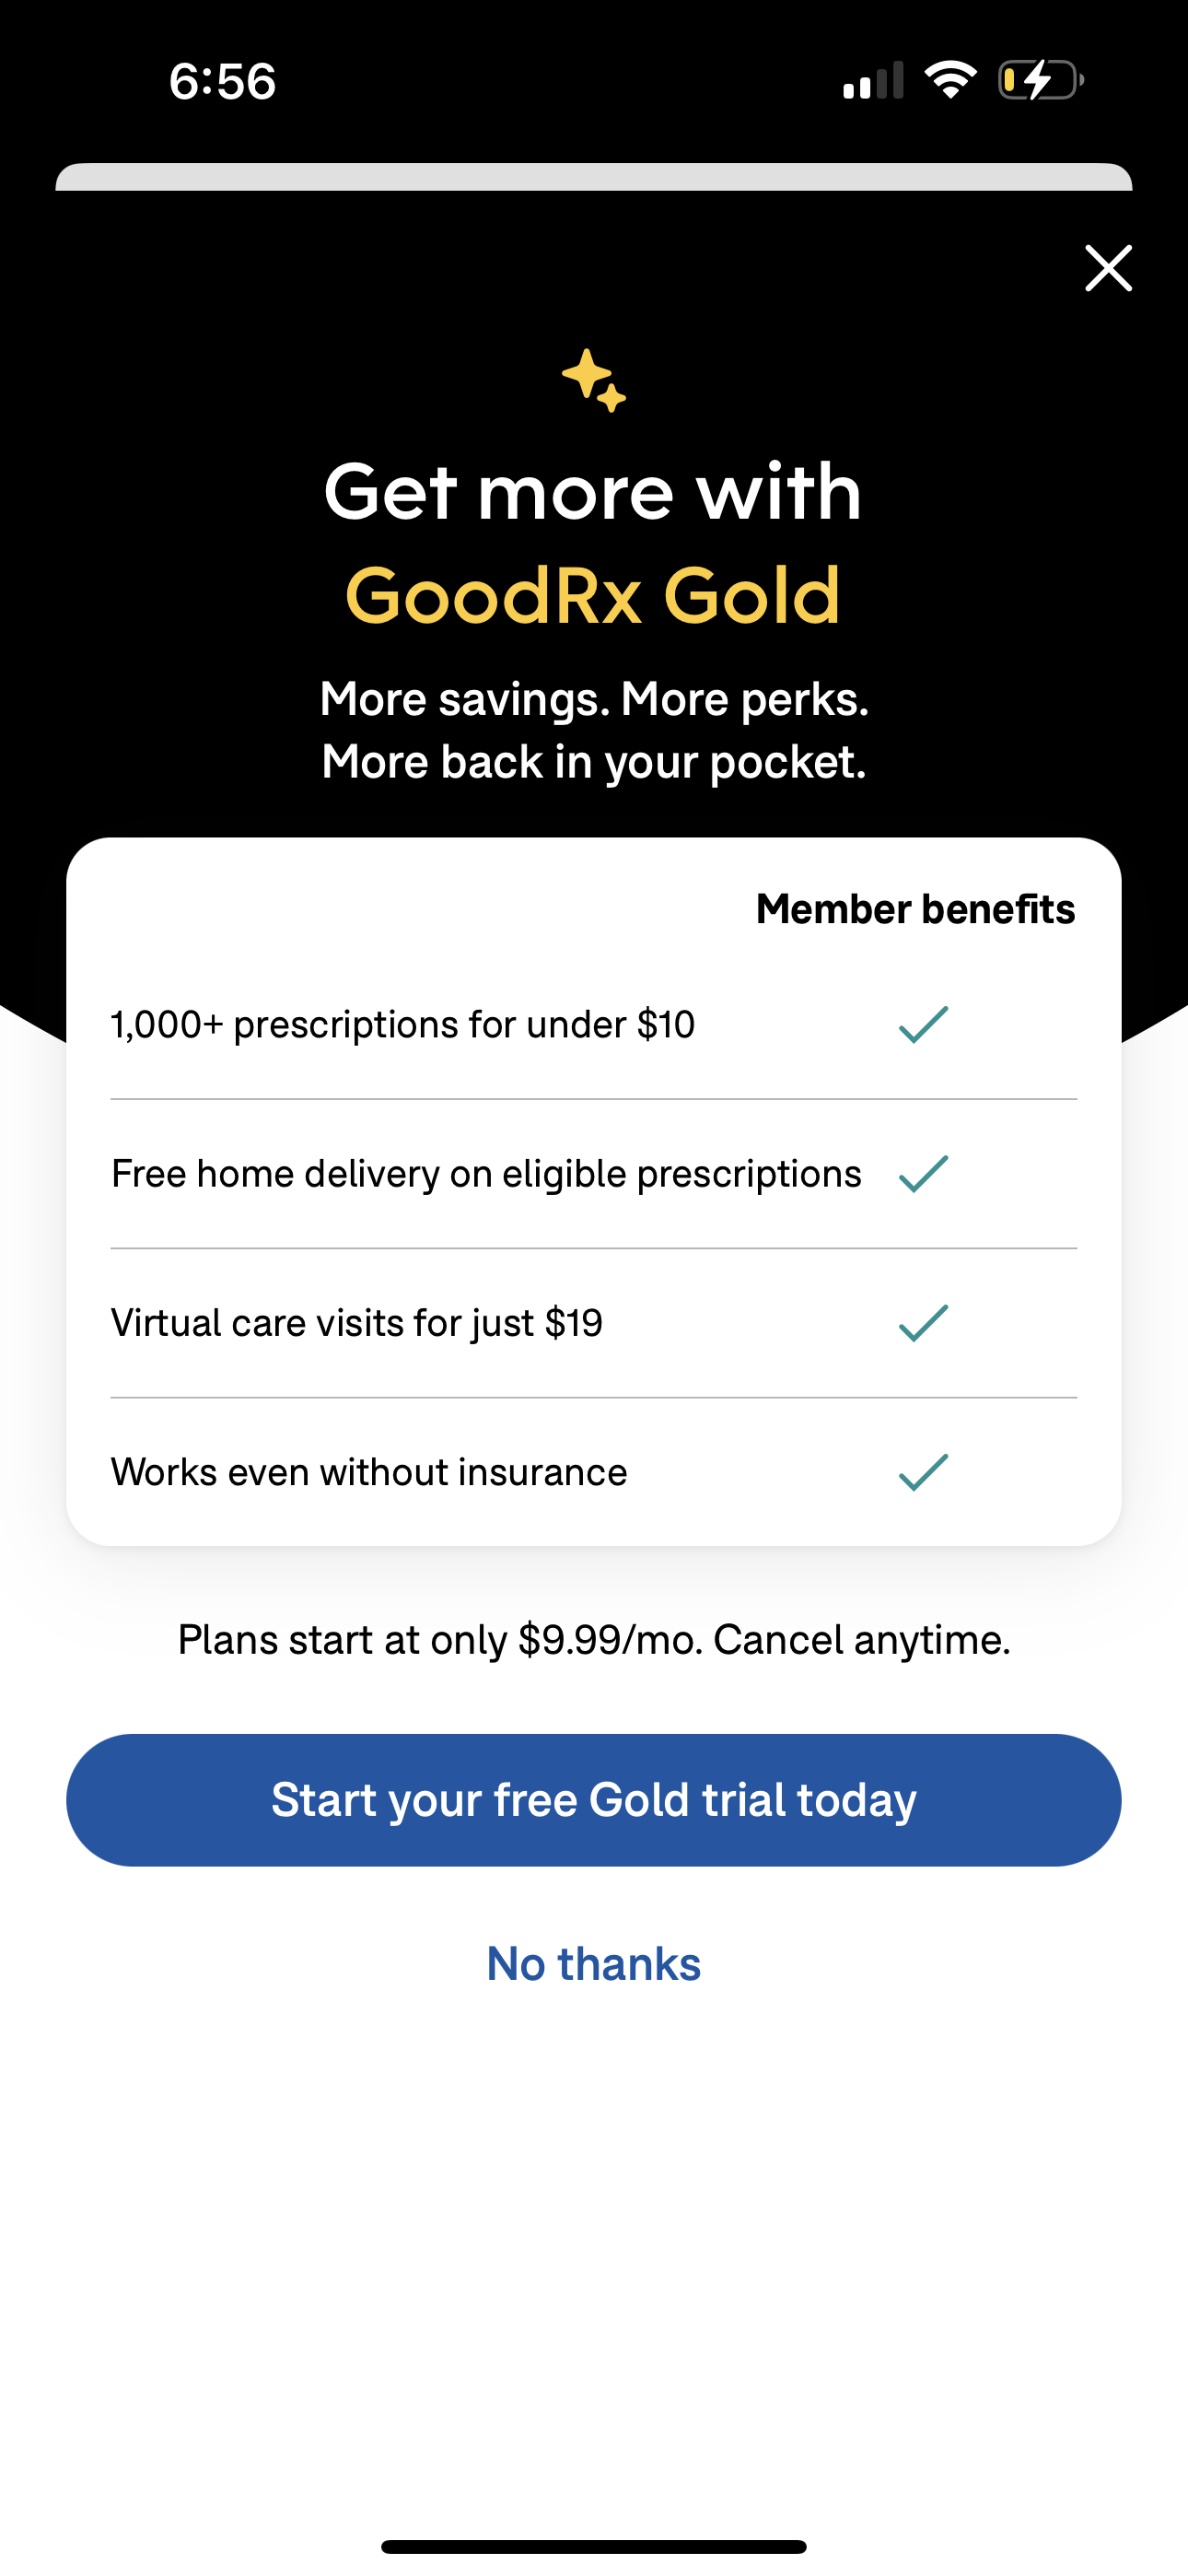
Price-in-button examples from the broader corpus show the pattern this category leans toward — a concrete number on the button itself:
At 10.3% price-in-CTA, Photo & Video is among the more price-forward verticals, and its low trial-led share suggests the offer often centers on the unlock/value rather than a countdown to charge [1][2].
How to apply this
If you run a photo/video app, know that the category norm is more price-and-unlock than free-trial-countdown — so a price-forward paywall is on-brand here, not aggressive [1][2]. That said, trial-led framing is *under*-used in this vertical (23.9%), which means adding a clear trial could differentiate you from category peers — worth testing rather than assuming price-forward is optimal [1]. Because length mentions are so sparse here, there's no dominant '7-day' expectation to match; pick a length from the cross-vertical norms (7-day default) and test [3].
Caveats
n=155 CTAs / 15 companies clears the n≥70 bar for the trial-led and price-in-CTA percentages, but per-length cells are all under 8, so no length breakdown is published for this vertical — absolute count only [3][7]. Category is a company-level join; trial-led is a keyword match; price detection looks for a currency/decimal + period unit in the button text [8]. Primary-role CTAs only; 39% unknown-role excluded [9].
The numbers
| Stat | Computed from |
|---|---|
| Photo & Video trial-led 23.9% (37/155), 15 companies | trial_led_by_category_photo_video: 37/155, 15 companies |
| Photo & Video price-in-CTA 10.3% (16/155) | trial_led_by_category_photo_video price-in-CTA 16/155=10.3% |
| Photo & Video any-length mentions = 7 (too sparse to split) | trial_led_by_category_photo_video any-day 7; smallSampleWarnings |
| All-app trial-led baseline 33.7% | trial_led_primary_share: 33.7% |
| All-app price-in-CTA baseline 11.6% | price_in_cta_share: 11.6% |
| Elevate '$3.3 per month', iam 'Only $49/year' price examples | qualitative price in CTA entries |
| n=155 clears n>=70 bar; length cells <8 | methodologyNotes + smallSampleWarnings |
| Price-in-CTA = currency+digits or decimal price + period unit in button | price_in_cta_share sql |
| 39% CTA rows role='unknown', excluded | universe note |
Sources & citations
- [1] Lazyweb Research analysis of 155 Photo & Video primary paywall CTAs (~800 tracked apps), July 2026. Category join on lower(company_name); trial-led keyword + price regex over CTA text. ↩
- [2] Lazyweb Research analysis of 1,886 primary paywall CTAs (~800 tracked apps), July 2026. All-app baselines for trial-led (33.7%) and price-in-CTA (11.6%). ↩
Source: Lazyweb Research — proprietary analysis of real, in-market app screens. Cite as Lazyweb Research, 2026-07-07.
Explore the evidence
Related questions
More in Free-trial framing and reassurance copy on paywalls →