Is the home-screen widget upsell growing in apps?
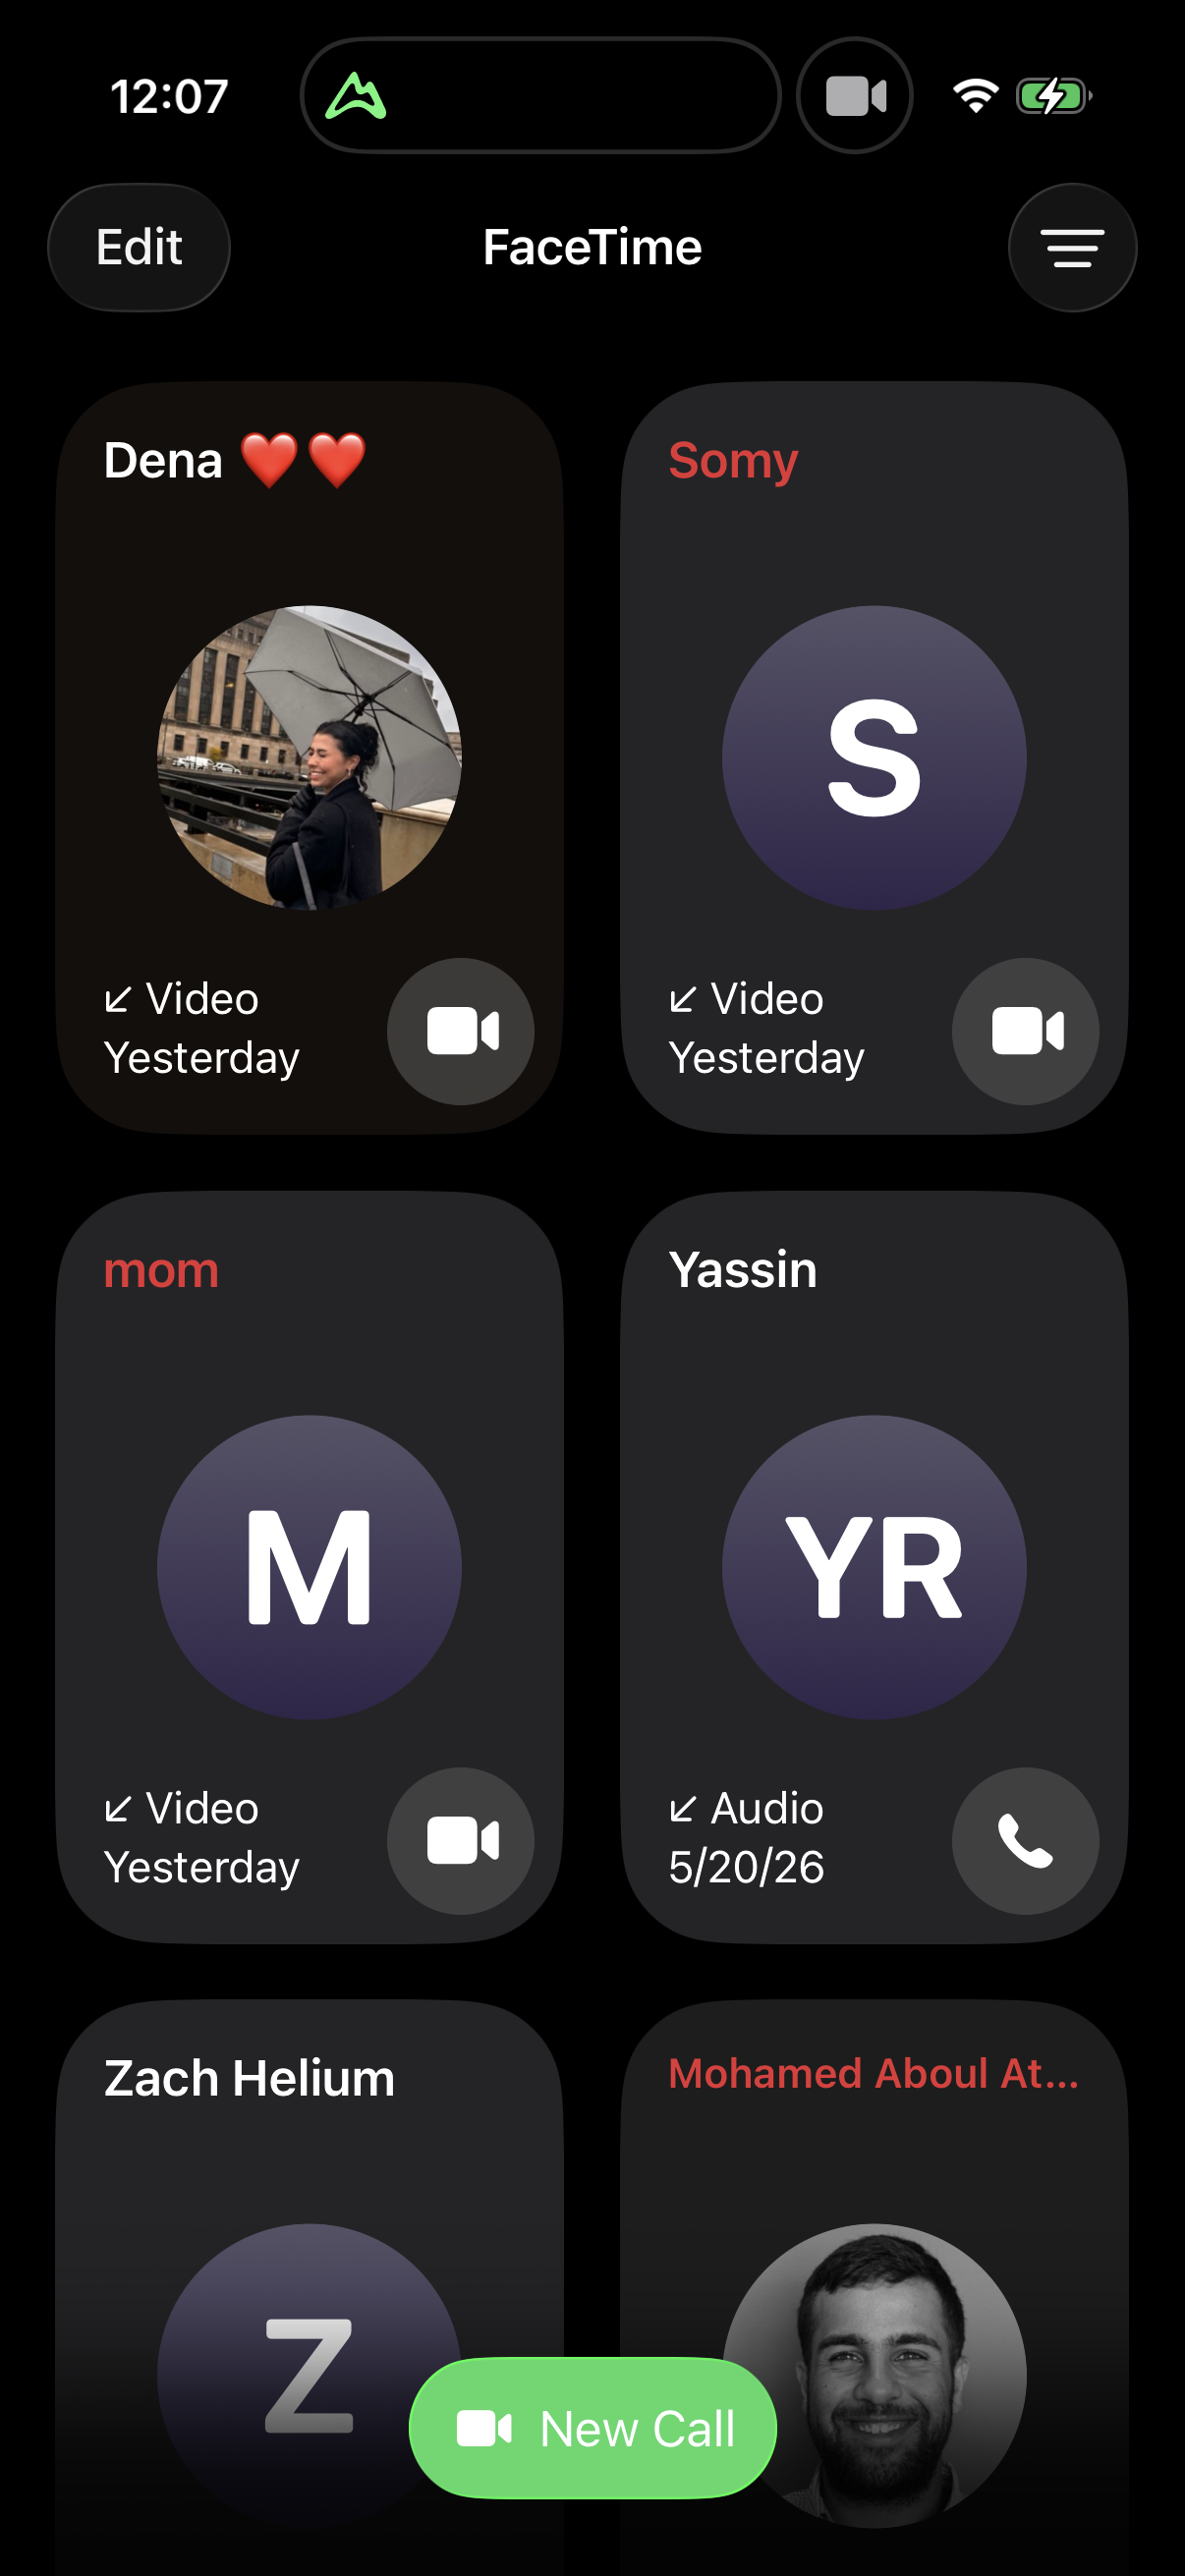
Yes, steadily. Home-screen widget upsells rose from 3.4% of captured apps in 2023 to 7.5% in 2025 (55 of 730 companies) - roughly a doubling off a small base [1]. It is a slow, consistent climb rather than a breakout. If you are deciding whether to prompt users to add a widget, the trend is quietly upward but still a minority pattern.
Home-screen widget upsells grew from 3.4% of captured apps in 2023 to 7.5% in 2025 (July 2026).

| Item | Companies with pattern |
|---|---|
| 2023 | 10 |
| 2024 | 21 |
| 2025 | 55 |
The trend: a steady climb off a small base
Share of captured apps showing a home-screen widget upsell, by capture year:
| Capture year | Companies with pattern | Cohort size | Prevalence |
|---|---|---|---|
| 2023 | 10 | 293 | 3.4% [1] |
| 2024 | 21 | 399 | 5.3% [1] |
| 2025 | 55 | 730 | 7.5% [1] |
Each year gained roughly two points of share - a consistent, monotonic climb, unlike the spike-and-retreat patterns (streaks, countdown timers) elsewhere in this family [1].
How to apply it
The steady, uninterrupted rise makes the widget upsell a lower-risk bet than the peaked patterns: it is still climbing, so you would be joining a growing behavior rather than a plateaued one. At 7.5% it remains a minority tactic, best suited to apps where a glanceable home-screen surface (weather, tracking, streaks, reminders) adds real daily value. Prompt for it after activation, not during onboarding, given the small base of apps that have made it work.
Caveats
Prevalence is deduped by distinct company and matched on %widget%; it is a lower bound bounded by tag recall, and the broad 'widget' term may catch some non-upsell widget UI [1]. Base sizes are small (10-55 companies), so treat the slope as directional [1]. Partial-2026 (4 apps) is excluded as a thin-capture artifact [2].
The numbers
| Stat | Computed from |
|---|---|
| 3.4% (2023, 10/293) -> 5.3% (2024, 21/399) -> 7.5% (2025, 55/730) | widget_upsell_prevalence_over_time |
| 2026 partial = 4 apps, excluded as thin-capture artifact | widget_upsell_prevalence_over_time / smallSampleWarnings |
Sources & citations
- [1] Lazyweb Research analysis of 809 tracked apps (mobile-app corpus, 47,578 capture-dated screenshots), July 2026. Prevalence = share of companies captured each year whose screens carry a `%widget%` tag, deduped by company_name. ↩
- [2] Lazyweb Research analysis of 809 tracked apps (mobile-app corpus, 47,578 capture-dated screenshots), July 2026. 2026 captures run only through Jul 4 with thin tagging; that year is excluded from the trend. ↩
Source: Lazyweb Research — proprietary analysis of real, in-market app screens. Cite as Lazyweb Research, 2026-07-07.