How Many Plan Options Do Mobile Paywalls Show — 1, 2, or 3?
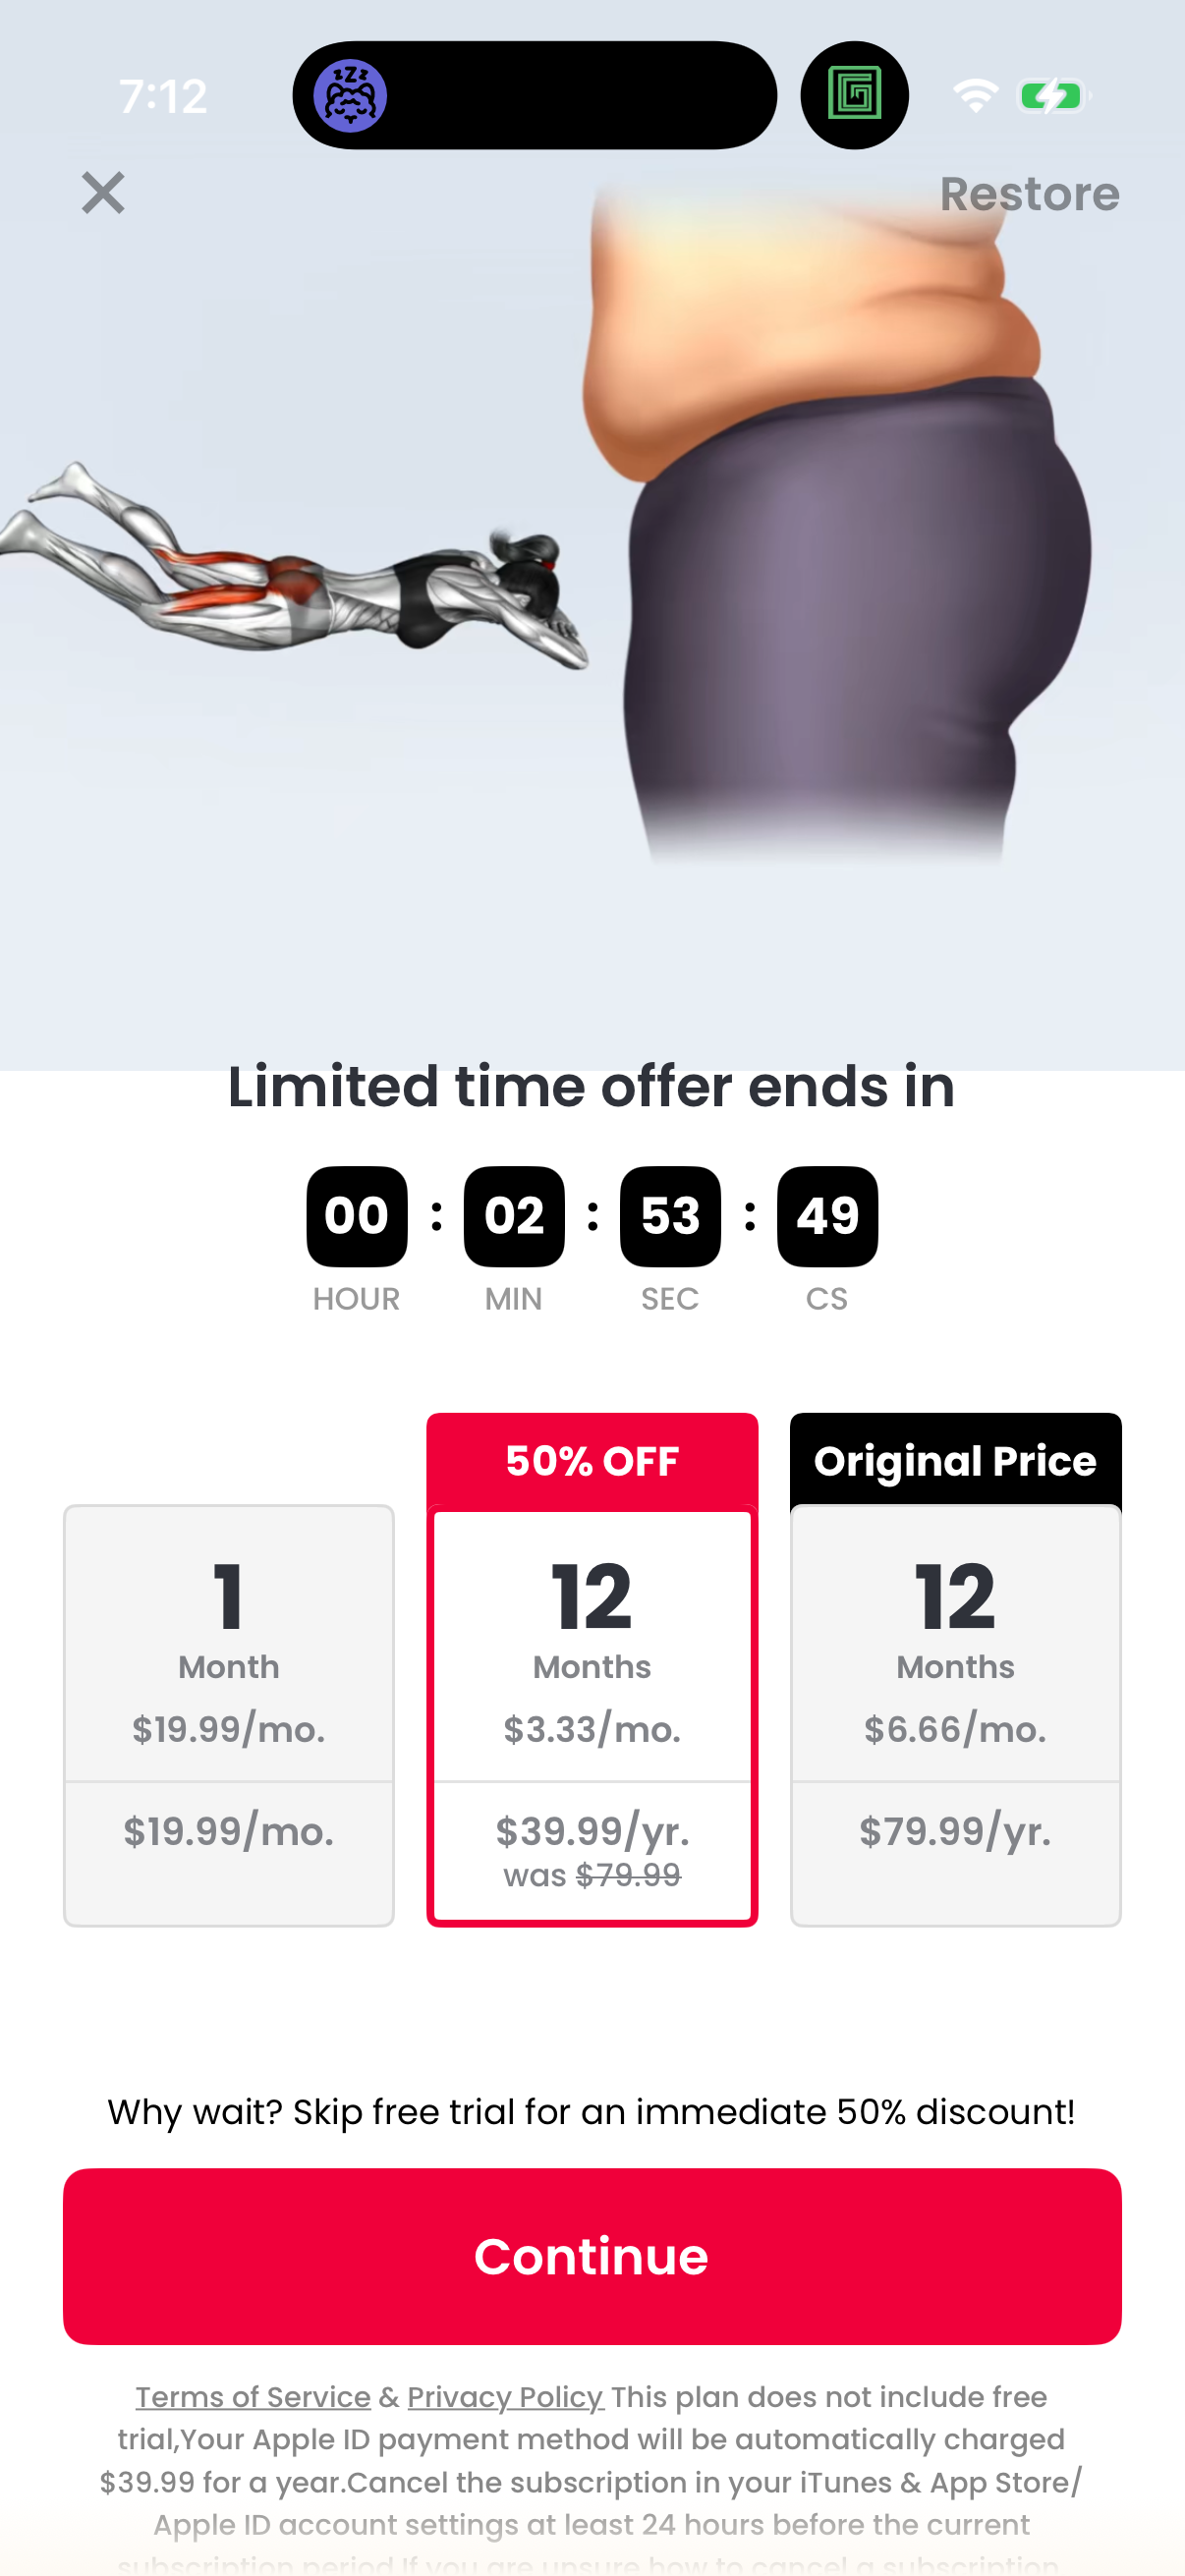
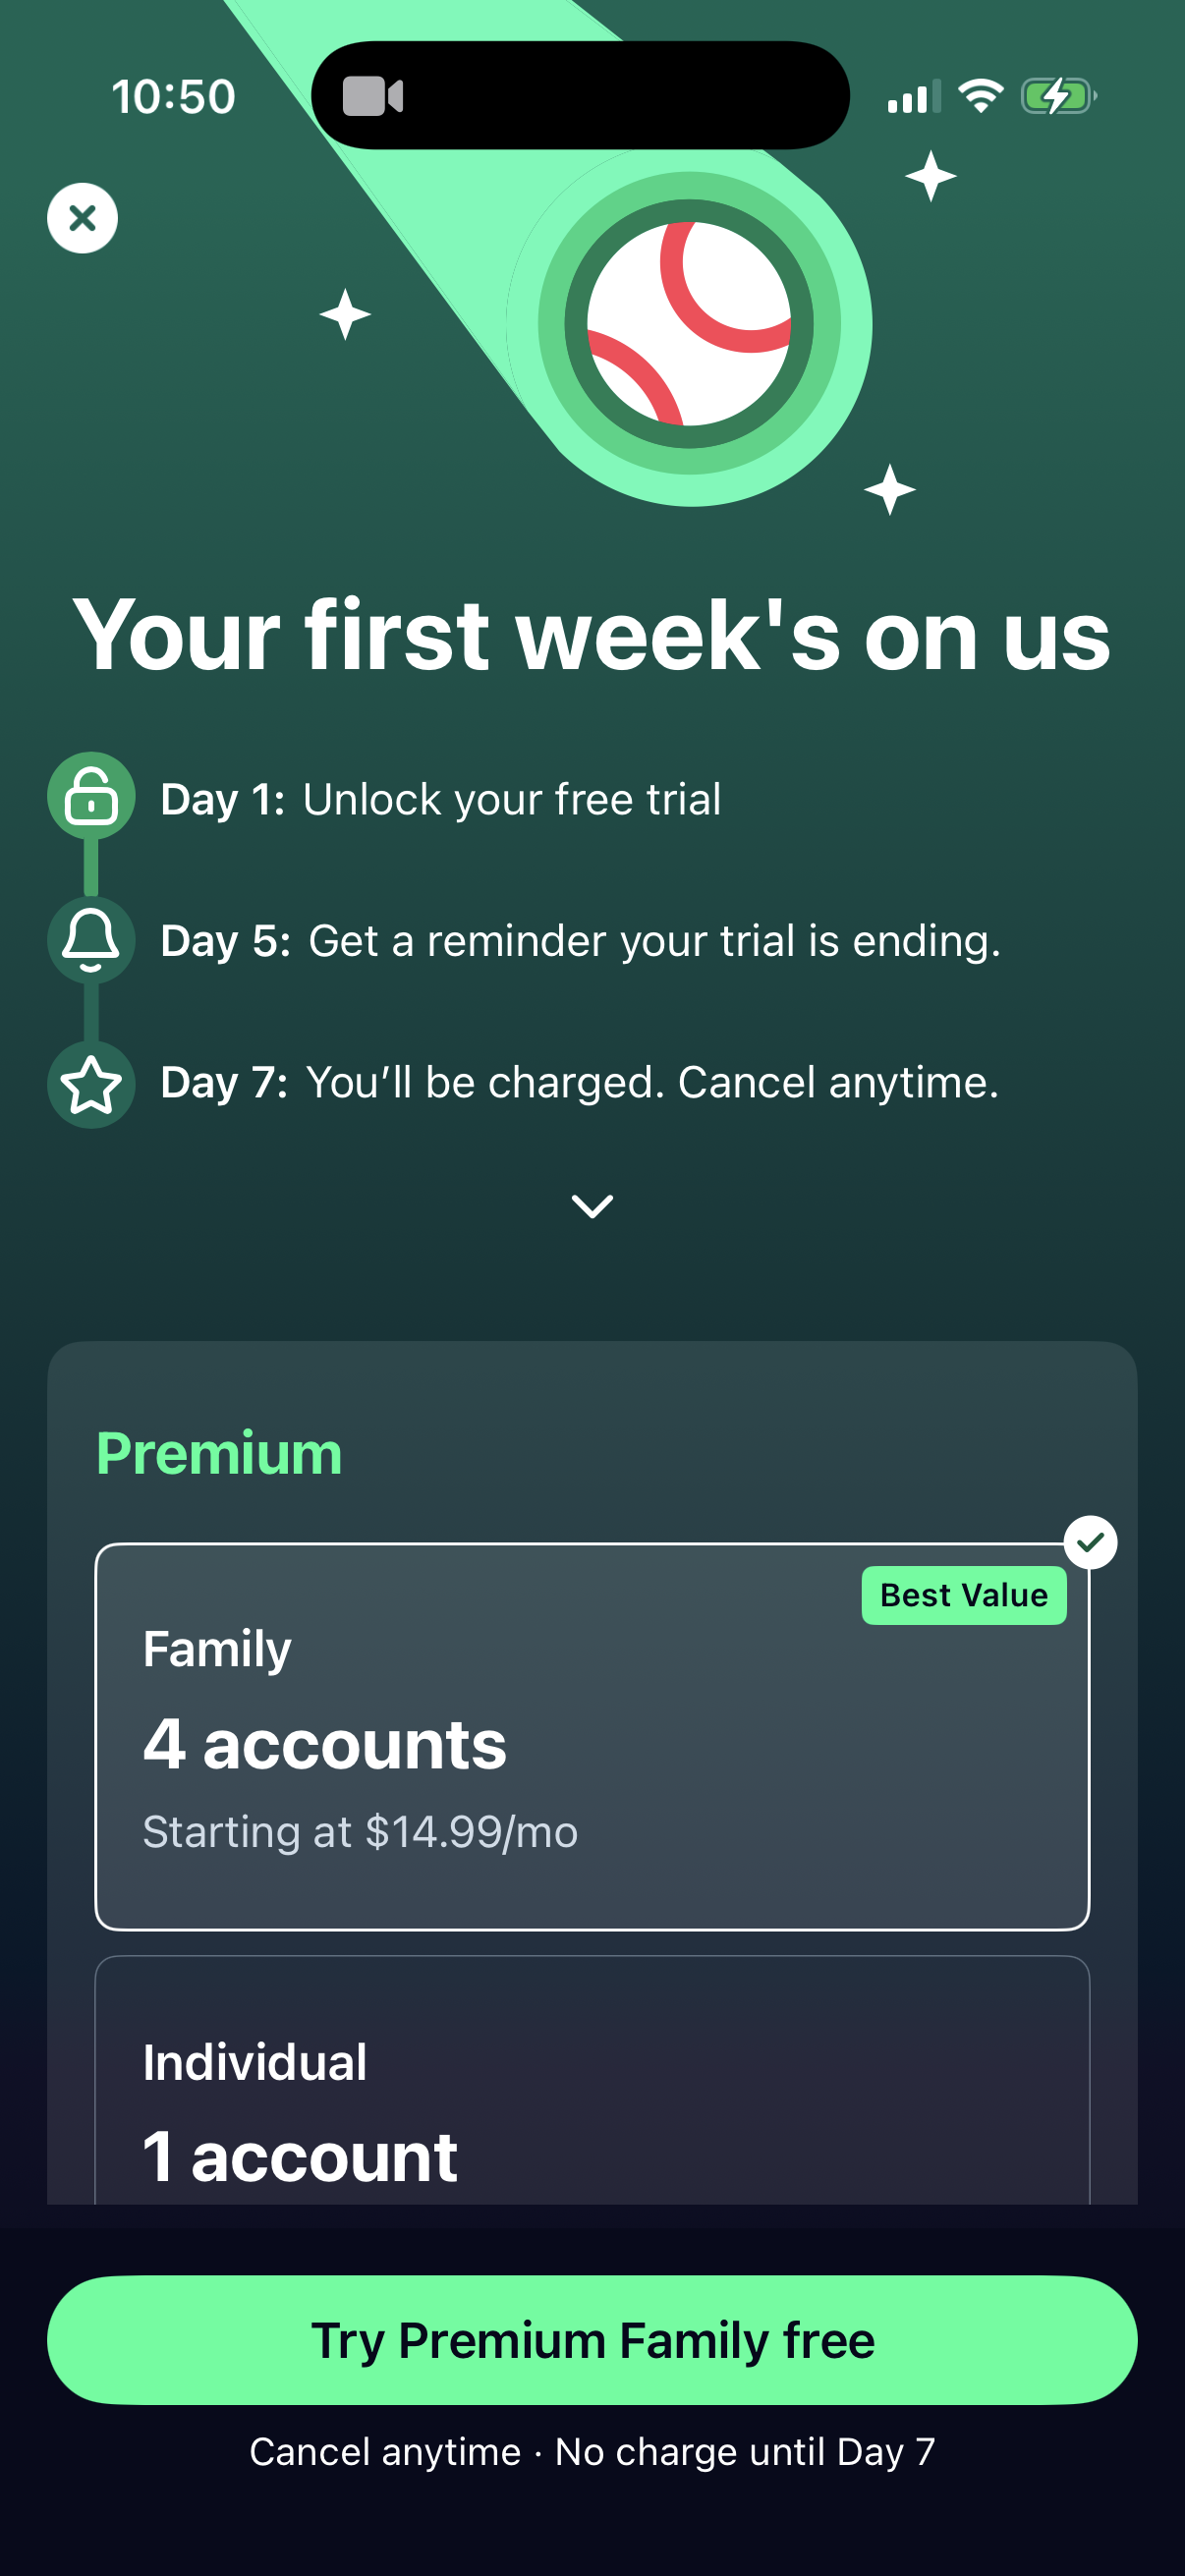
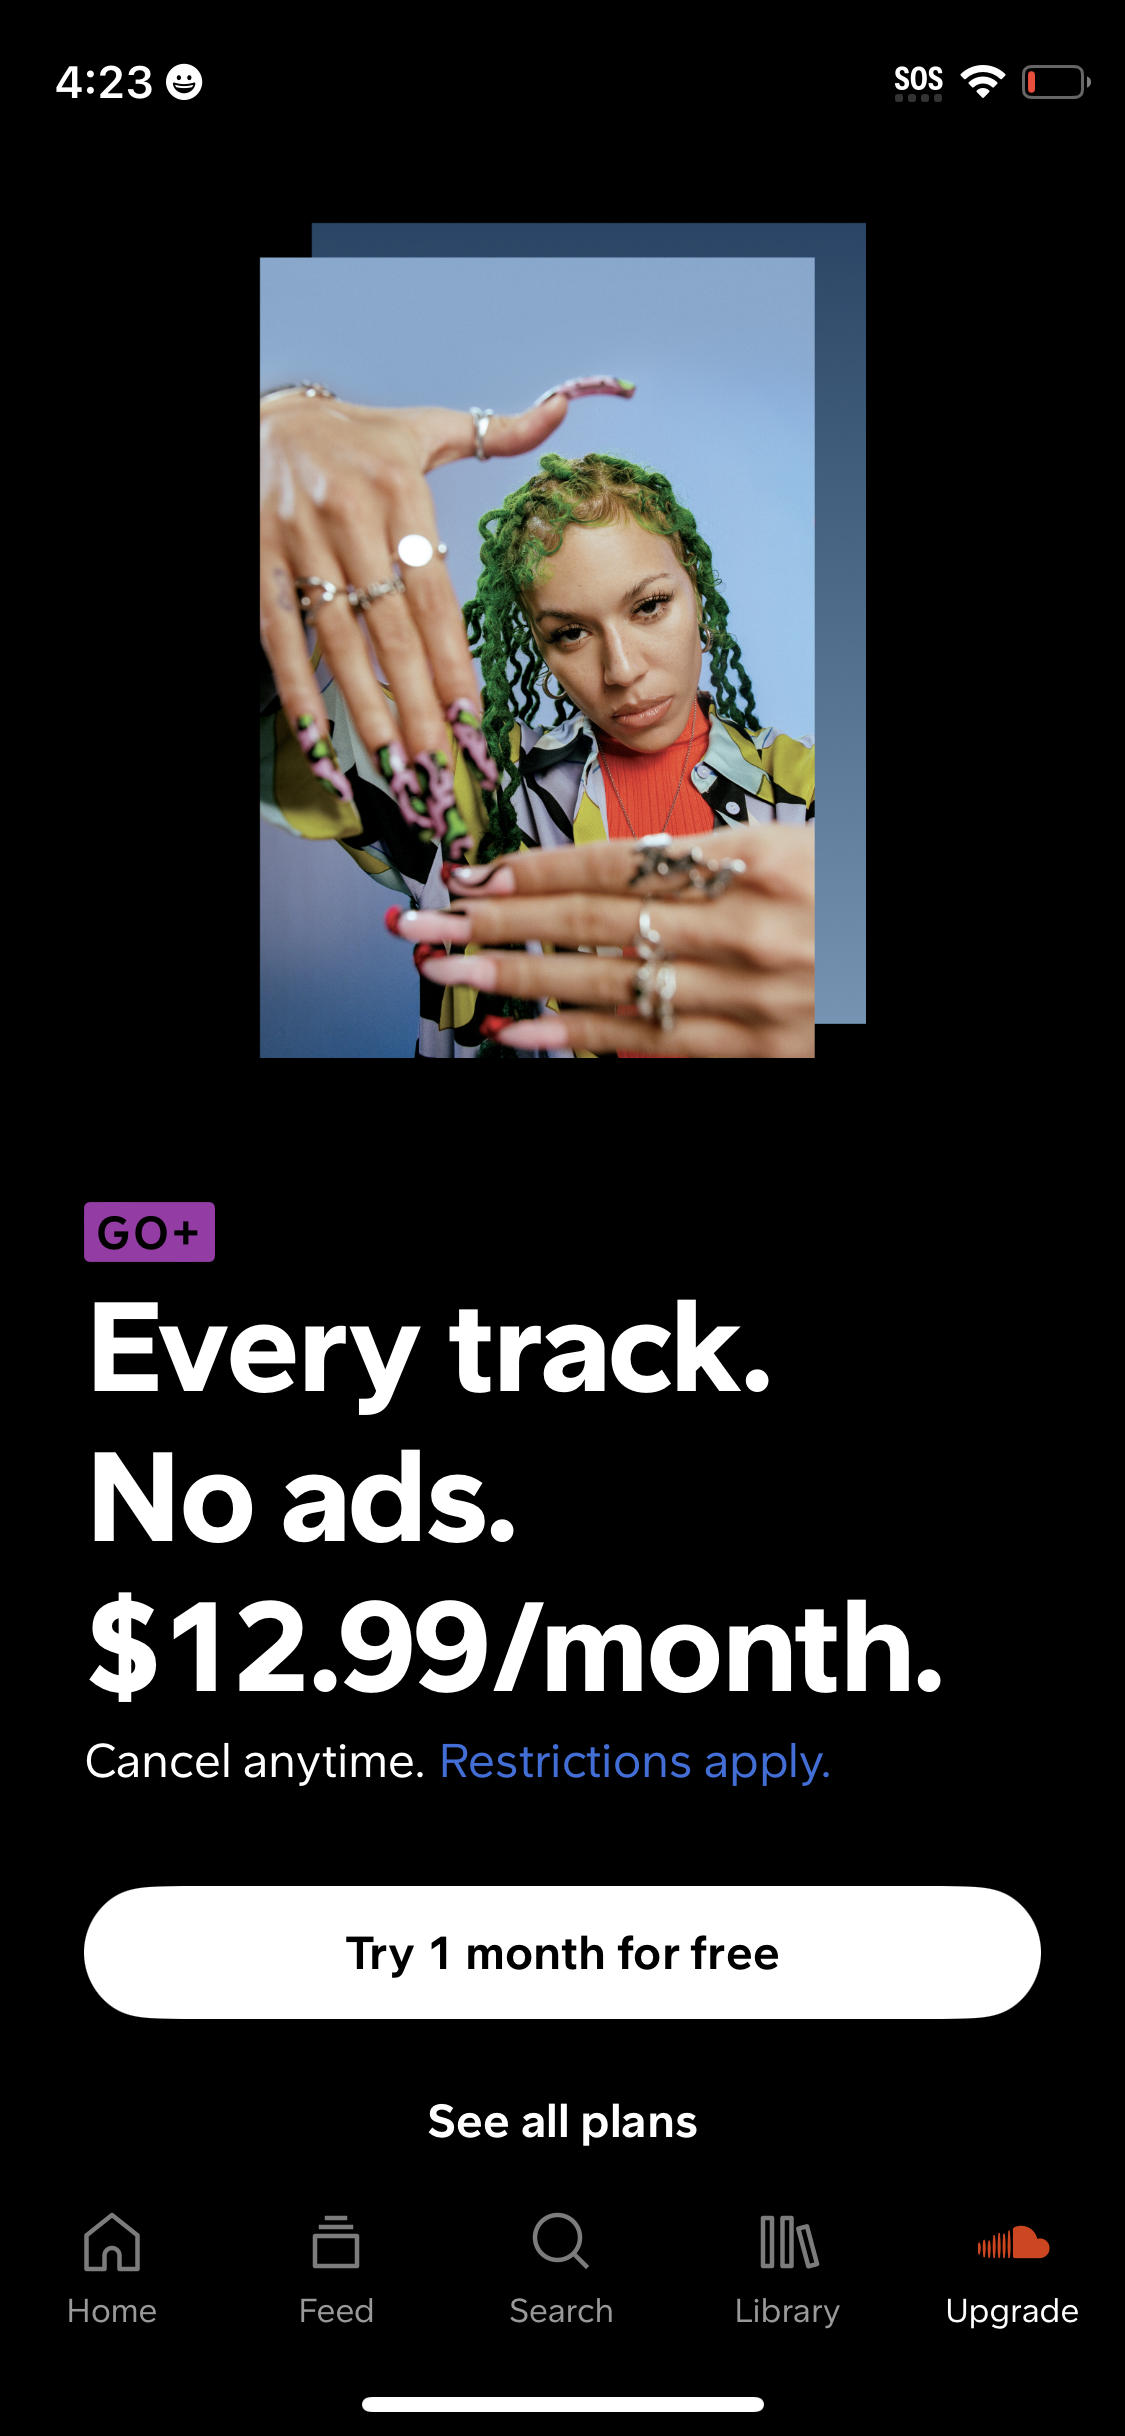
Among 734 mobile paywalls with at least one billing period visible in Lazyweb's corpus, 51.5% show exactly two plan options, 42.2% show a single option, and only 6.3% show three or more.[1] Two plans (typically a shorter period paired with annual) is the modal structure. If you are deciding how many options to put on a paywall, two is the benchmark and three-plus is rare.
51.5% of 734 mobile paywalls with visible pricing show exactly two plan options, versus 6.3% showing three or more (Lazyweb Research, July 2026).
| Item | Share of 734 |
|---|---|
| 1 period | 42.2% |
| 2 periods | 51.5% |
| 3+ periods | 6.3% |
The finding
Across 734 paywalls where at least one billing period is legible, two-plan layouts dominate at 51.5% (378 paywalls).[1][2] Single-plan paywalls are the next most common at 42.2% (310).[1] Three-or-more-plan paywalls are the exception at 6.3% (46).[1] Note the denominator: 470 of the 1,204 described paywalls show no billing period at all in the vision description — hard paywalls, teaser screens, or gaps in extraction — so all percentages here use the 734 paywalls with visible pricing, never the full 1,297-screen corpus.[3][4]
Distribution
| Plan options visible | Paywalls | Share of 734 |
|---|---|---|
| 1 period | 310 | 42.2% |
| 2 periods | 378 | 51.5% |
| 3+ periods | 46 | 6.3% |
Billing periods here are weekly, monthly, annual, and lifetime detected in the vision description across all screenshots of each canonical paywall.[1]
How to apply it
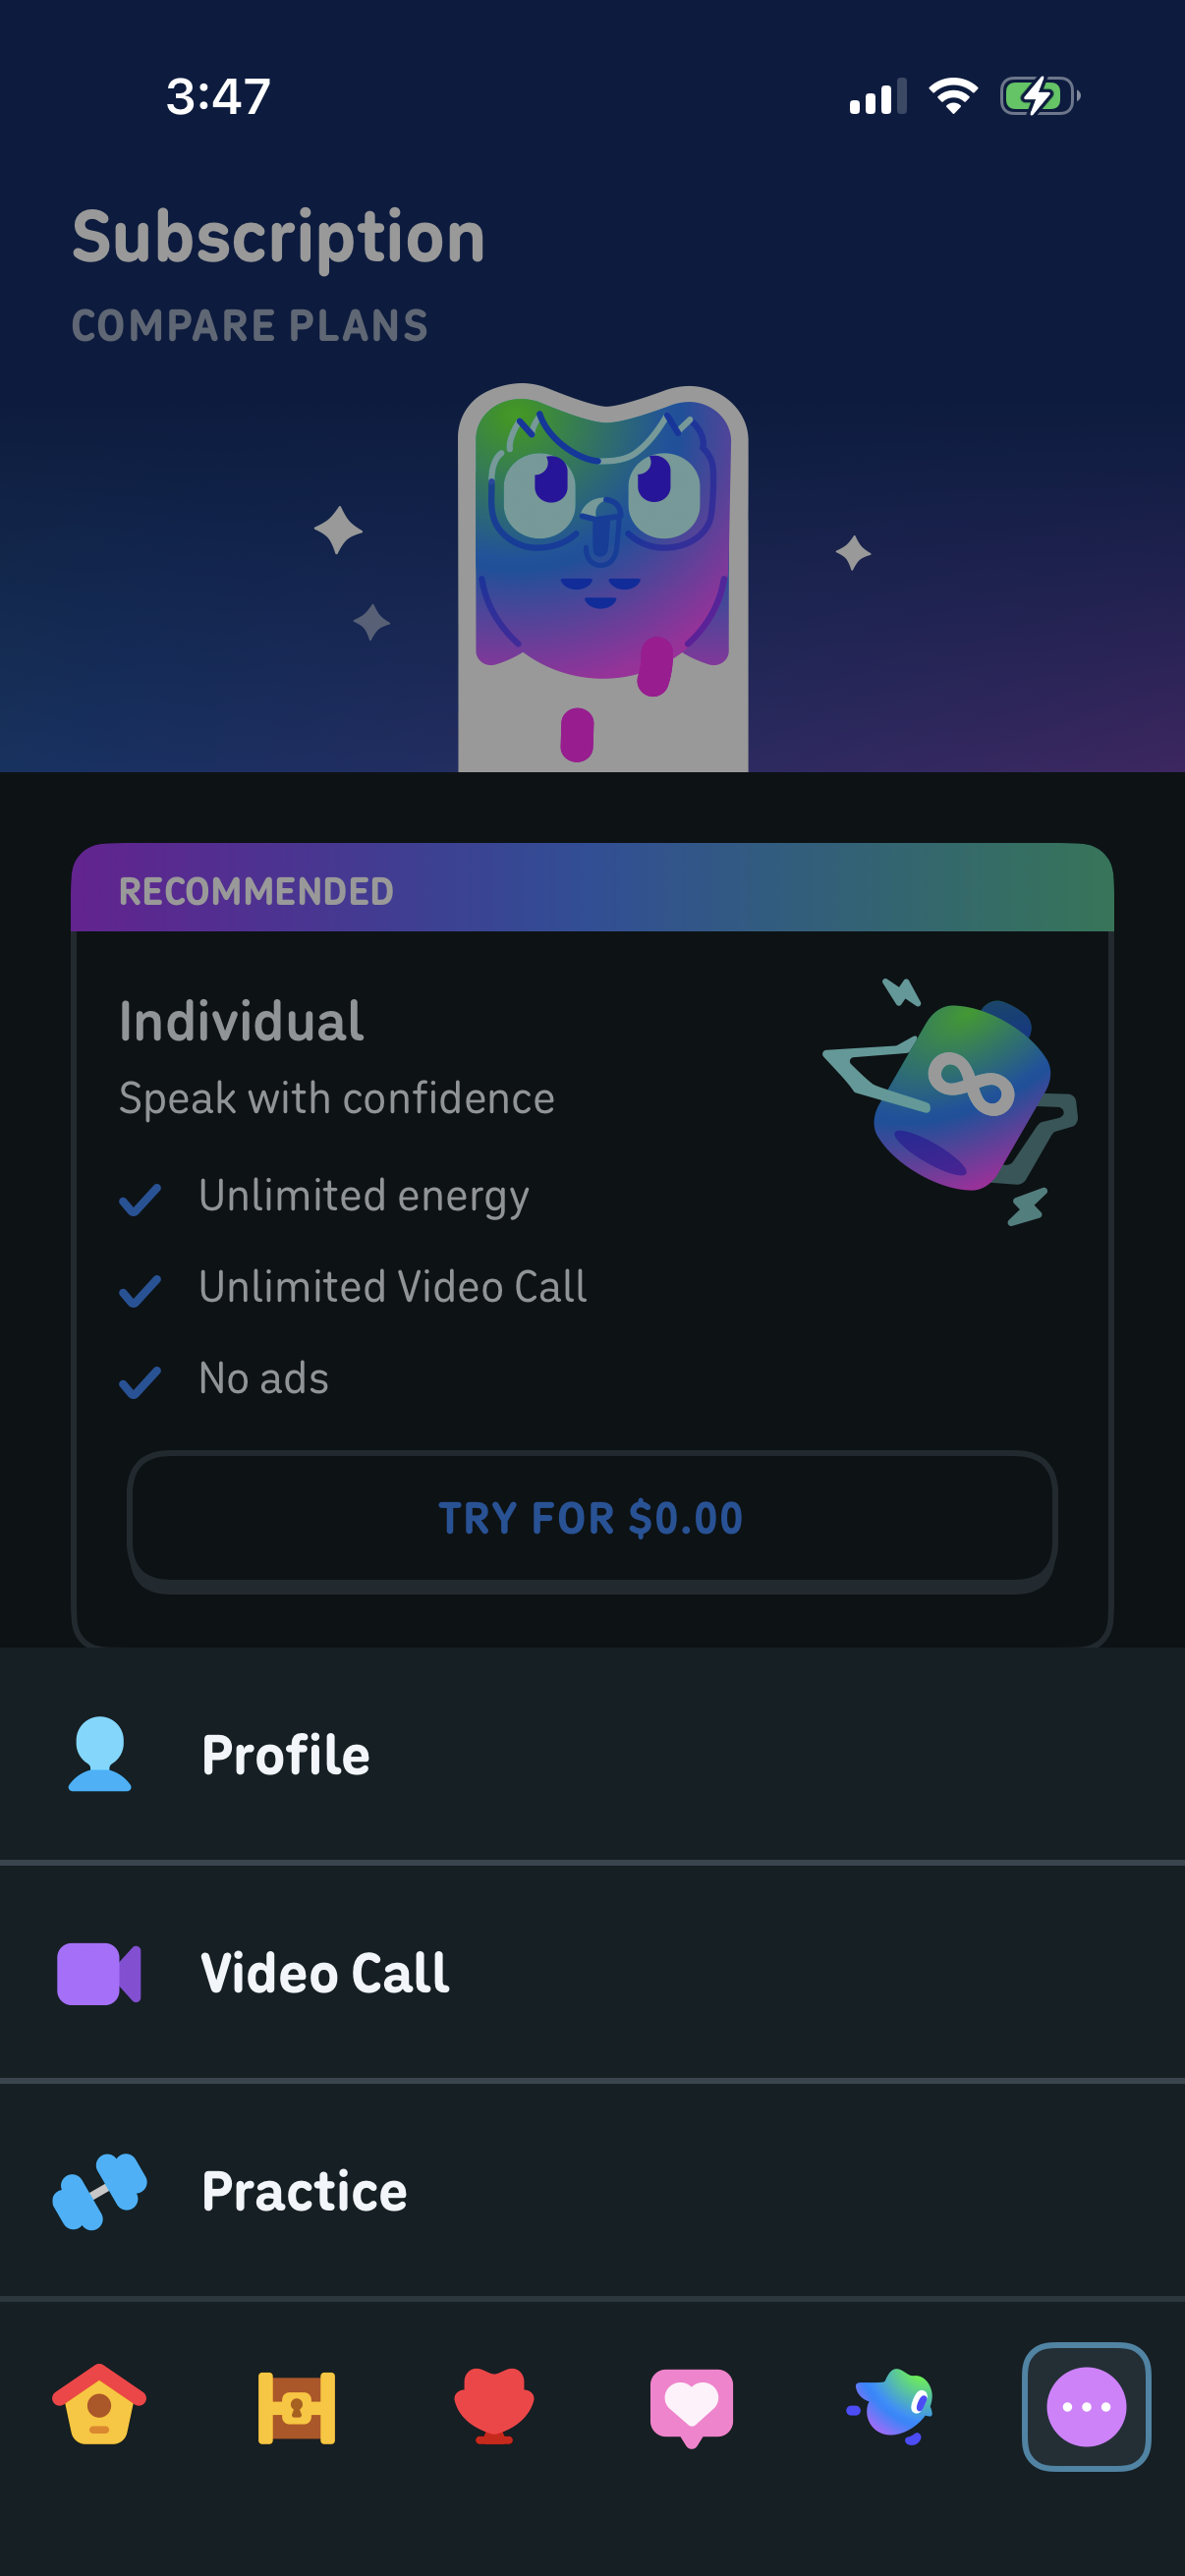
Default to a two-plan paywall unless you have a specific reason not to. A single plan (42.2%) is a legitimate, common choice for products that lead with one hero price and a trial. Three-plus options are used by only 6.3% of paywalls[1] — reserve that structure for products with genuinely distinct tiers (e.g. individual vs family), and expect the extra cognitive load. Because 470 paywalls show no visible pricing at all, a hard/teaser paywall that defers the plan choice is also a mainstream pattern.[3]
Caveats
Plan count is a proxy: it counts distinct billing periods detected in LLM vision descriptions (bool_or across every screenshot of a canonical), not a structured plan-picker parse, so it is a lower bound where a period is present on screen but not described.[1] Percentages exclude the 470 paywalls with zero described periods.[3]
The numbers
| Stat | Computed from |
|---|---|
| 1 period 310 (42.2%), 2 periods 378 (51.5%), 3+ periods 46 (6.3%) of 734 | plan_count_distribution_overall: among 734 paywalls with >=1 visible period, 1=310, 2=378, 3+=46 (44+2) |
| 378 two-plan paywalls | plan_count_distribution_overall numerator 378 / denominator 734 |
| 470 of 1,204 described paywalls show no billing period | plan_count_distribution_overall: 470/1,204 show 0 periods |
| 1,297 canonical paywall screens / 1,204 with vision descriptions | paywall_universe (1,297) and extraction coverage (1,204 with descriptions) |
Sources & citations
- [1] Lazyweb Research analysis of 734 paywalls with visible pricing (~800 tracked apps), July 2026. Distinct billing periods per canonical paywall, detected via regex over LLM vision descriptions, bool_or across all screenshots; denominator is paywalls with >=1 visible period, not the full corpus. ↩
- [2] Lazyweb Research analysis of 1,297 canonical paywall screens (~800 tracked apps), July 2026. Canonical paywall corpus (1,297 screens / 5,971 screenshots); 1,204 canonicals carry a vision description. ↩
Source: Lazyweb Research — proprietary analysis of real, in-market app screens. Cite as Lazyweb Research, 2026-07-07.