How Far Into Onboarding Do Apps Place the Paywall?
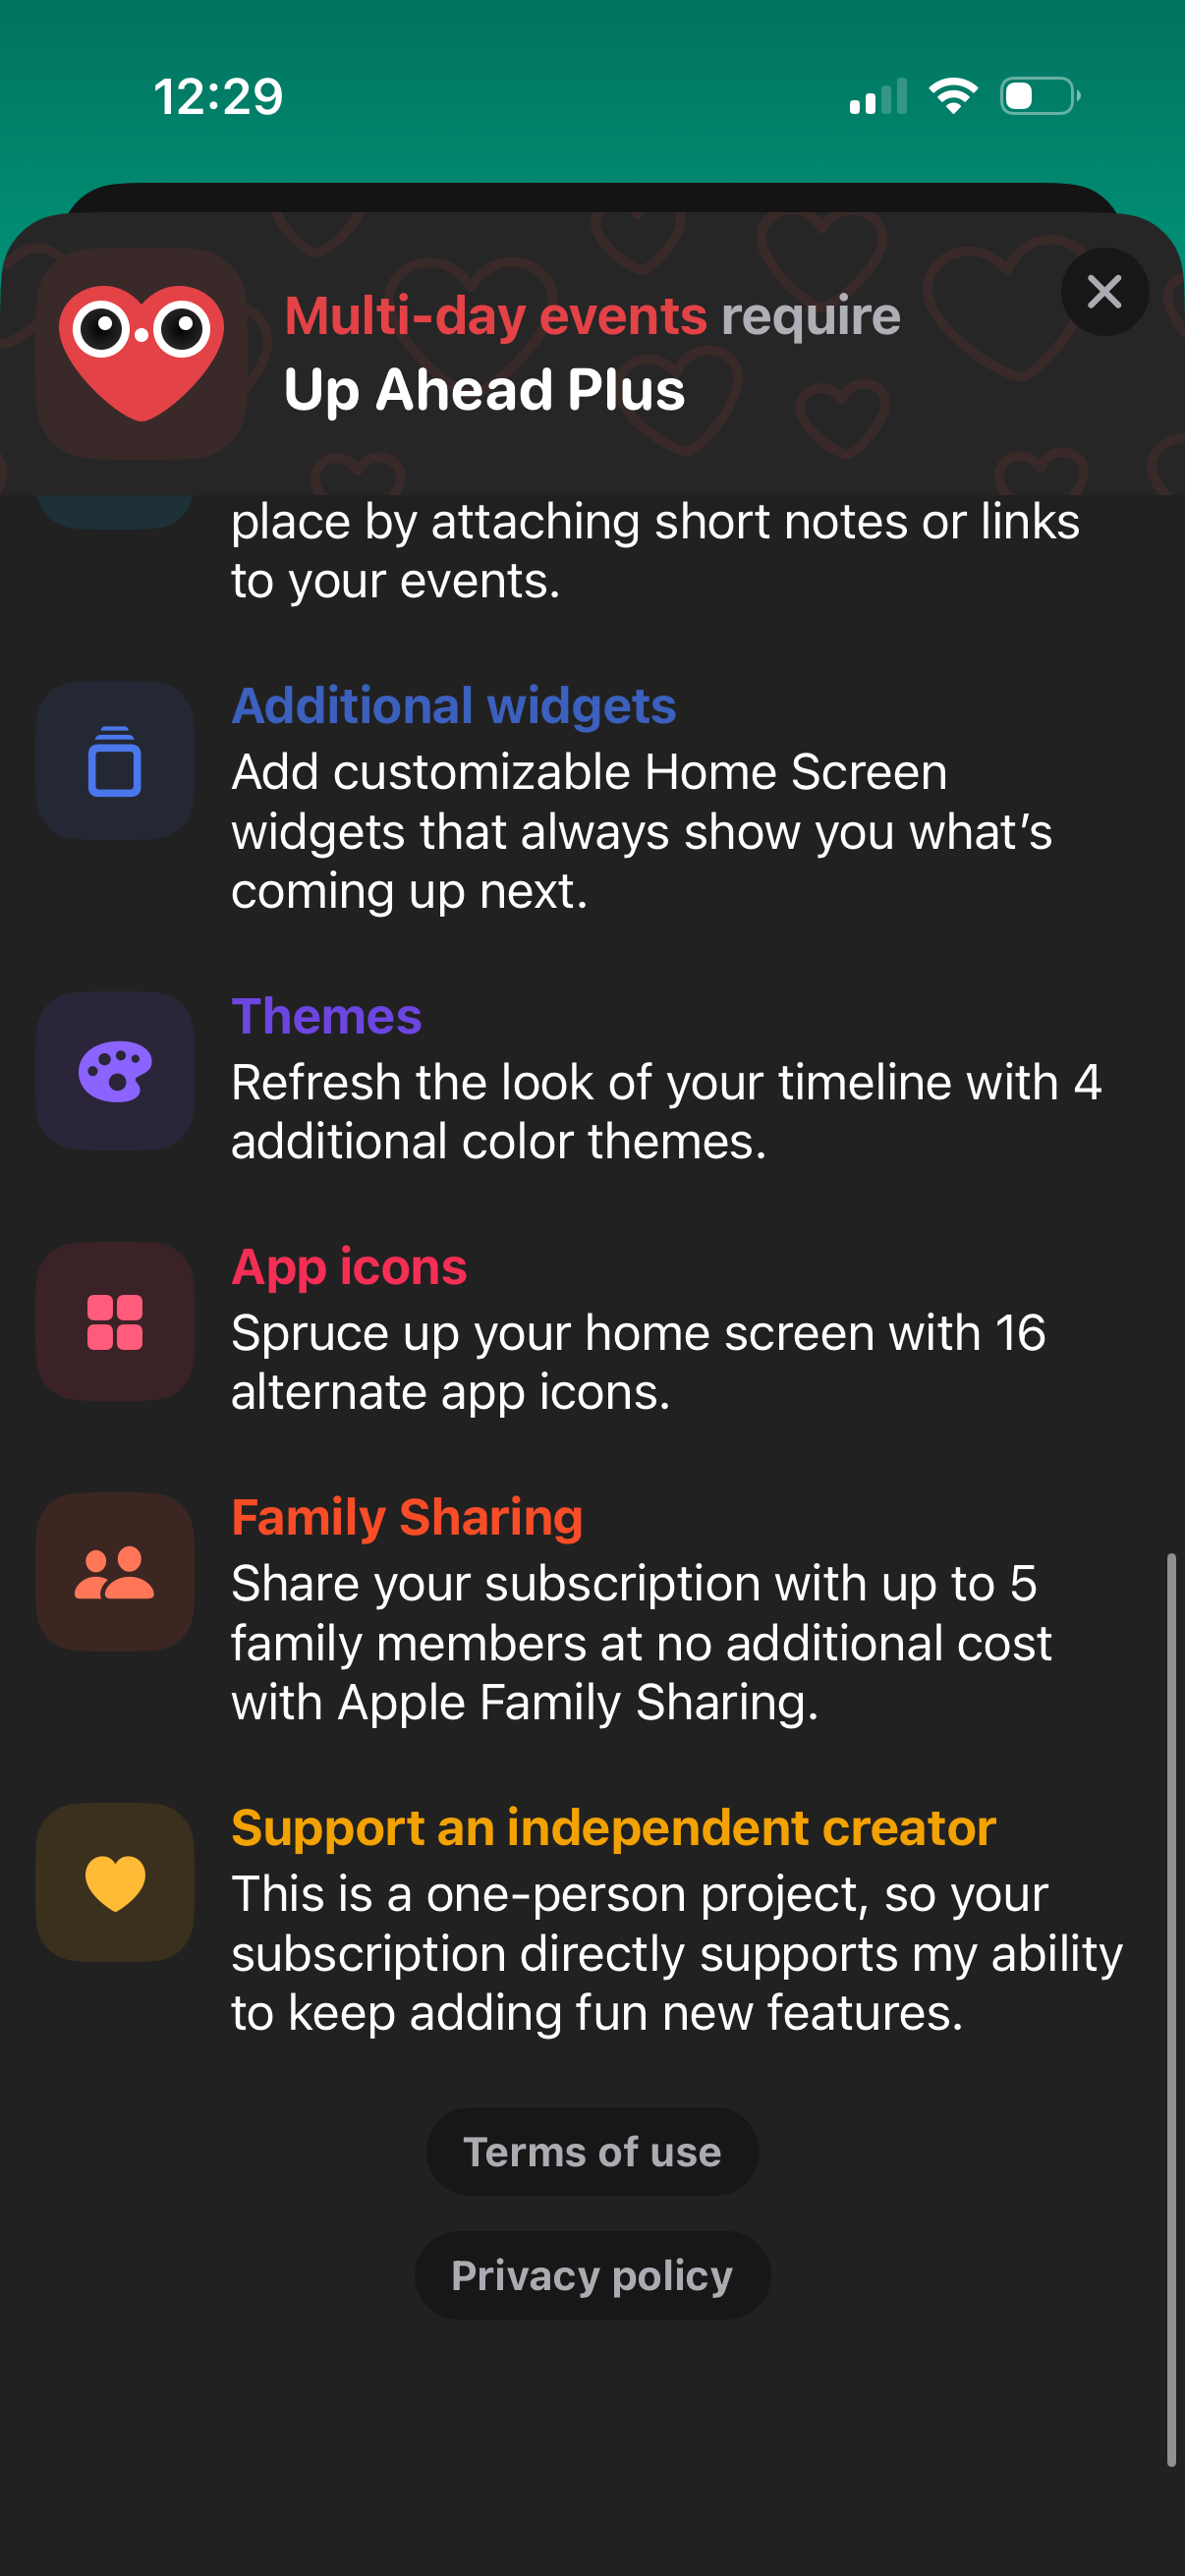
Across the 40 onboarding flows with a paywall tracked by Lazyweb Research, the first paywall lands at a mean relative position of 0.82 and a median of 0.89 of the flow [1] — in absolute terms, a median of step 11 in a flow that averages 17.2 steps [2]. Apps overwhelmingly place the paywall near the end of onboarding, after the user has invested effort. No flow in the set opens with a paywall [3].
The first onboarding paywall appears at a median relative position of 0.89 (median step 11 of ~17), Lazyweb Research, July 2026 (N=40 flows).


| Item | Share |
|---|---|
| First third (<=0.33) | 2.5% |
| Middle third (0.33-0.66) | 20% |
| Final third (>0.66) | 77.5% |
| On the very last step | 27.5% |
| On the very first step | 0% |
The finding
In the 40 onboarding flows that contain a paywall, the first paywall appears at a mean relative position of 0.822 and a median of 0.894 [1], where 1.0 is the last step. Absolutely, that is a mean of step 14.3 and a median of step 11, in flows averaging 17.2 steps [2]. Across all 53 paywall steps inside onboarding flows, the average relative position is 0.851 [4].
Where the first paywall lands, by third of the flow
| Segment of flow | Flows | Share |
|---|---|---|
| First third (<=0.33) | 1 | 2.5% |
| Middle third (0.33-0.66) | 8 | 20% |
| Final third (>0.66) | 31 | 77.5% |
| On the very last step | 11 | 27.5% |
| On the very first step | 0 | 0% |
77.5% of first paywalls fall in the final third of onboarding, and 27.5% sit on the literal last step [3].
How to apply it
The dominant pattern is 'earn the paywall': collect preferences, personalize, then present the offer at or near the end. The screen immediately before the first paywall is a generic onboarding screen in 28 of 40 flows, with named exceptions like plan-ready and summary reveal screens [5] — consistent with a value-recap-then-paywall structure. If you are placing a paywall before roughly the 66% mark, you are in the minority (9 of 40 flows) [3].
Caveats
N is 40 flows; relative position depends on ROW_NUMBER over flow steps, not raw step numbers (raw AVG(step) is meaningless because step is not a 1..N index) [1]. Outliers like Adobe placing a paywall at step 3 of 13 (relative 0.23) are single-company anecdotes, not a pattern [5].
The numbers
| Stat | Computed from |
|---|---|
| first paywall mean 0.822 / median 0.894 relative position | first_paywall_relative_position |
| mean step 14.3, median step 11, avg 17.2-step flow | first_paywall_absolute_step |
| final third 31/40 (77.5%); last step 11/40 (27.5%); first step 0/40 | first_paywall_thirds_distribution |
| 53 paywall steps at avg relative position 0.851 | avg_relative_position_paywall_steps_onboarding |
| preceding screen generic in 28/40; Adobe step 3/13 (rel 0.23) | qualitative |
Sources & citations
- [1] Lazyweb Research analysis of 40 onboarding flows (~800 tracked apps), July 2026. First paywall = MIN(ROW_NUMBER) where is_paywall; relative position = rn/total steps. ↩
- [2] Lazyweb Research analysis of 40 onboarding flows (~800 tracked apps), July 2026. Absolute first-paywall step and mean flow length across the 40 paywalling flows. ↩
- [3] Lazyweb Research analysis of 40 onboarding flows (~800 tracked apps), July 2026. Distribution of first-paywall relative position into thirds; last-step and first-step counts. ↩
- [4] Lazyweb Research analysis of 53 paywall steps in onboarding flows (~800 tracked apps), July 2026. All 53 paywall steps of 1,790 onboarding steps; avg relative position 0.851. ↩
- [5] Lazyweb Research qualitative review of 40 onboarding flows (~800 tracked apps), July 2026. Preceding-screen categories and per-company examples pulled from flagged flows. ↩
Source: Lazyweb Research — proprietary analysis of real, in-market app screens. Cite as Lazyweb Research, 2026-07-07.
Explore the evidence
Related questions
More in Paywall timing: where the paywall appears in the flow →