Hero vs Pricing: Which Should I A/B Test First?
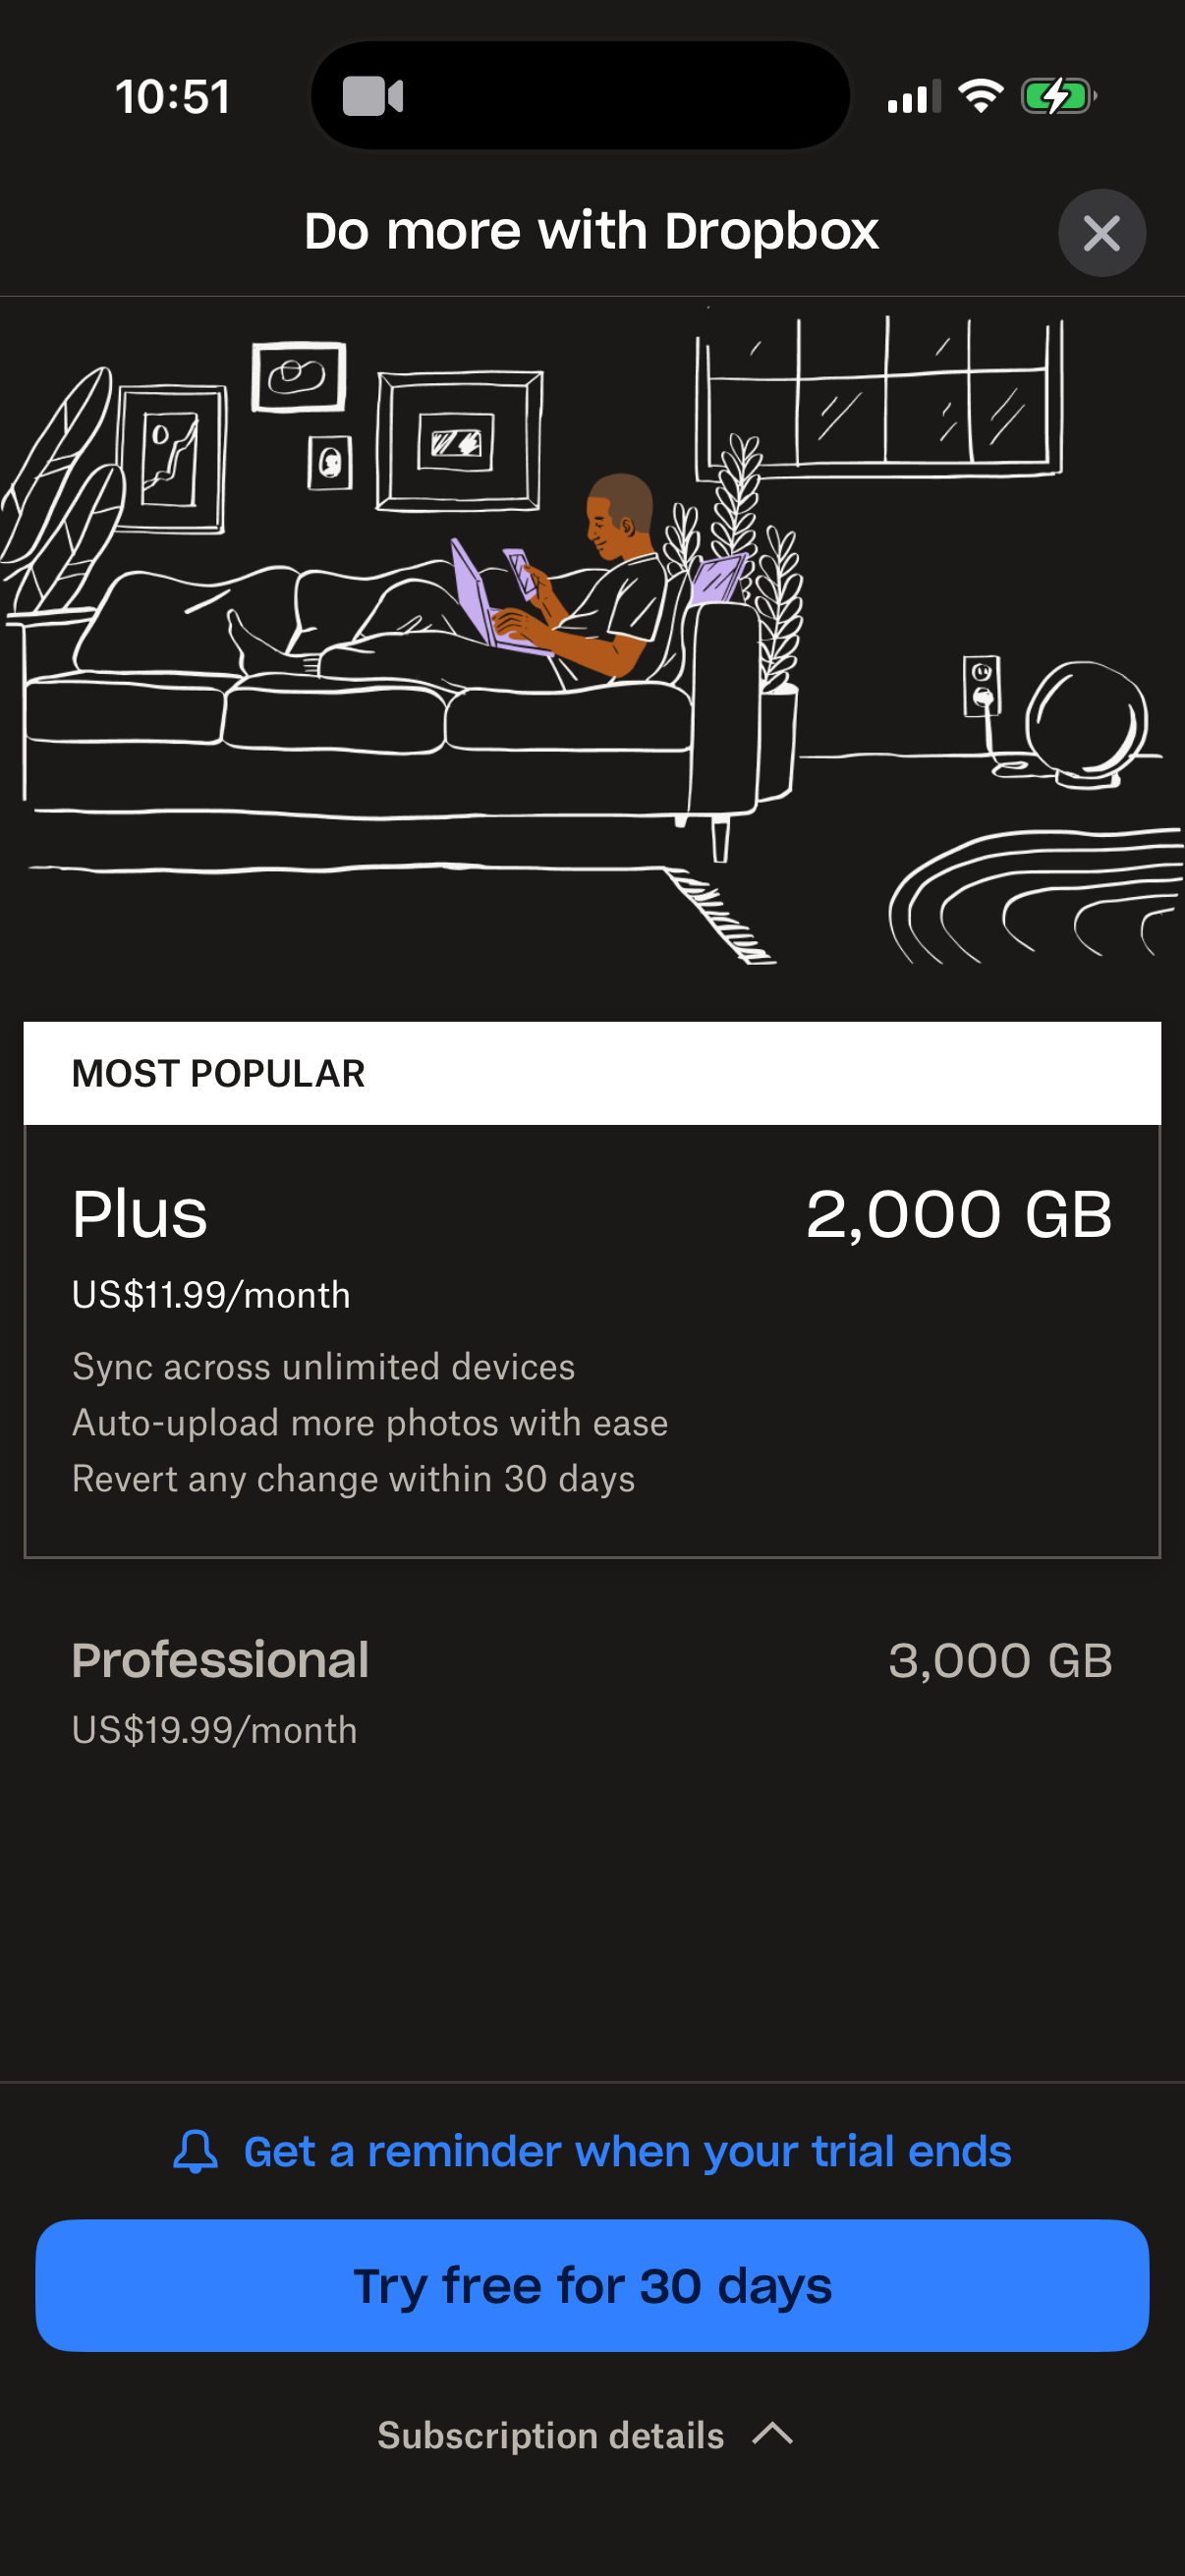
Across 2,160 area annotations Lazyweb Research tracked in July 2026, the hero is tested more often (488 annotations, 23.2%) but pricing scores higher on model-assigned impact (3.53 vs 3.28, with 53.8% of pricing tests rated 4+/5 versus 28.1% for hero). The tiebreaker is your traffic: hero is tested on both web and mobile (272/216), while pricing is 84% mobile and paywall-driven. Test the surface that matches where your users decide. [1]
Pricing tests are rated high-impact almost twice as often as hero tests — 53.8% vs 28.1% scored 4+/5 — though the hero is tested more overall, Lazyweb Research, July 2026.


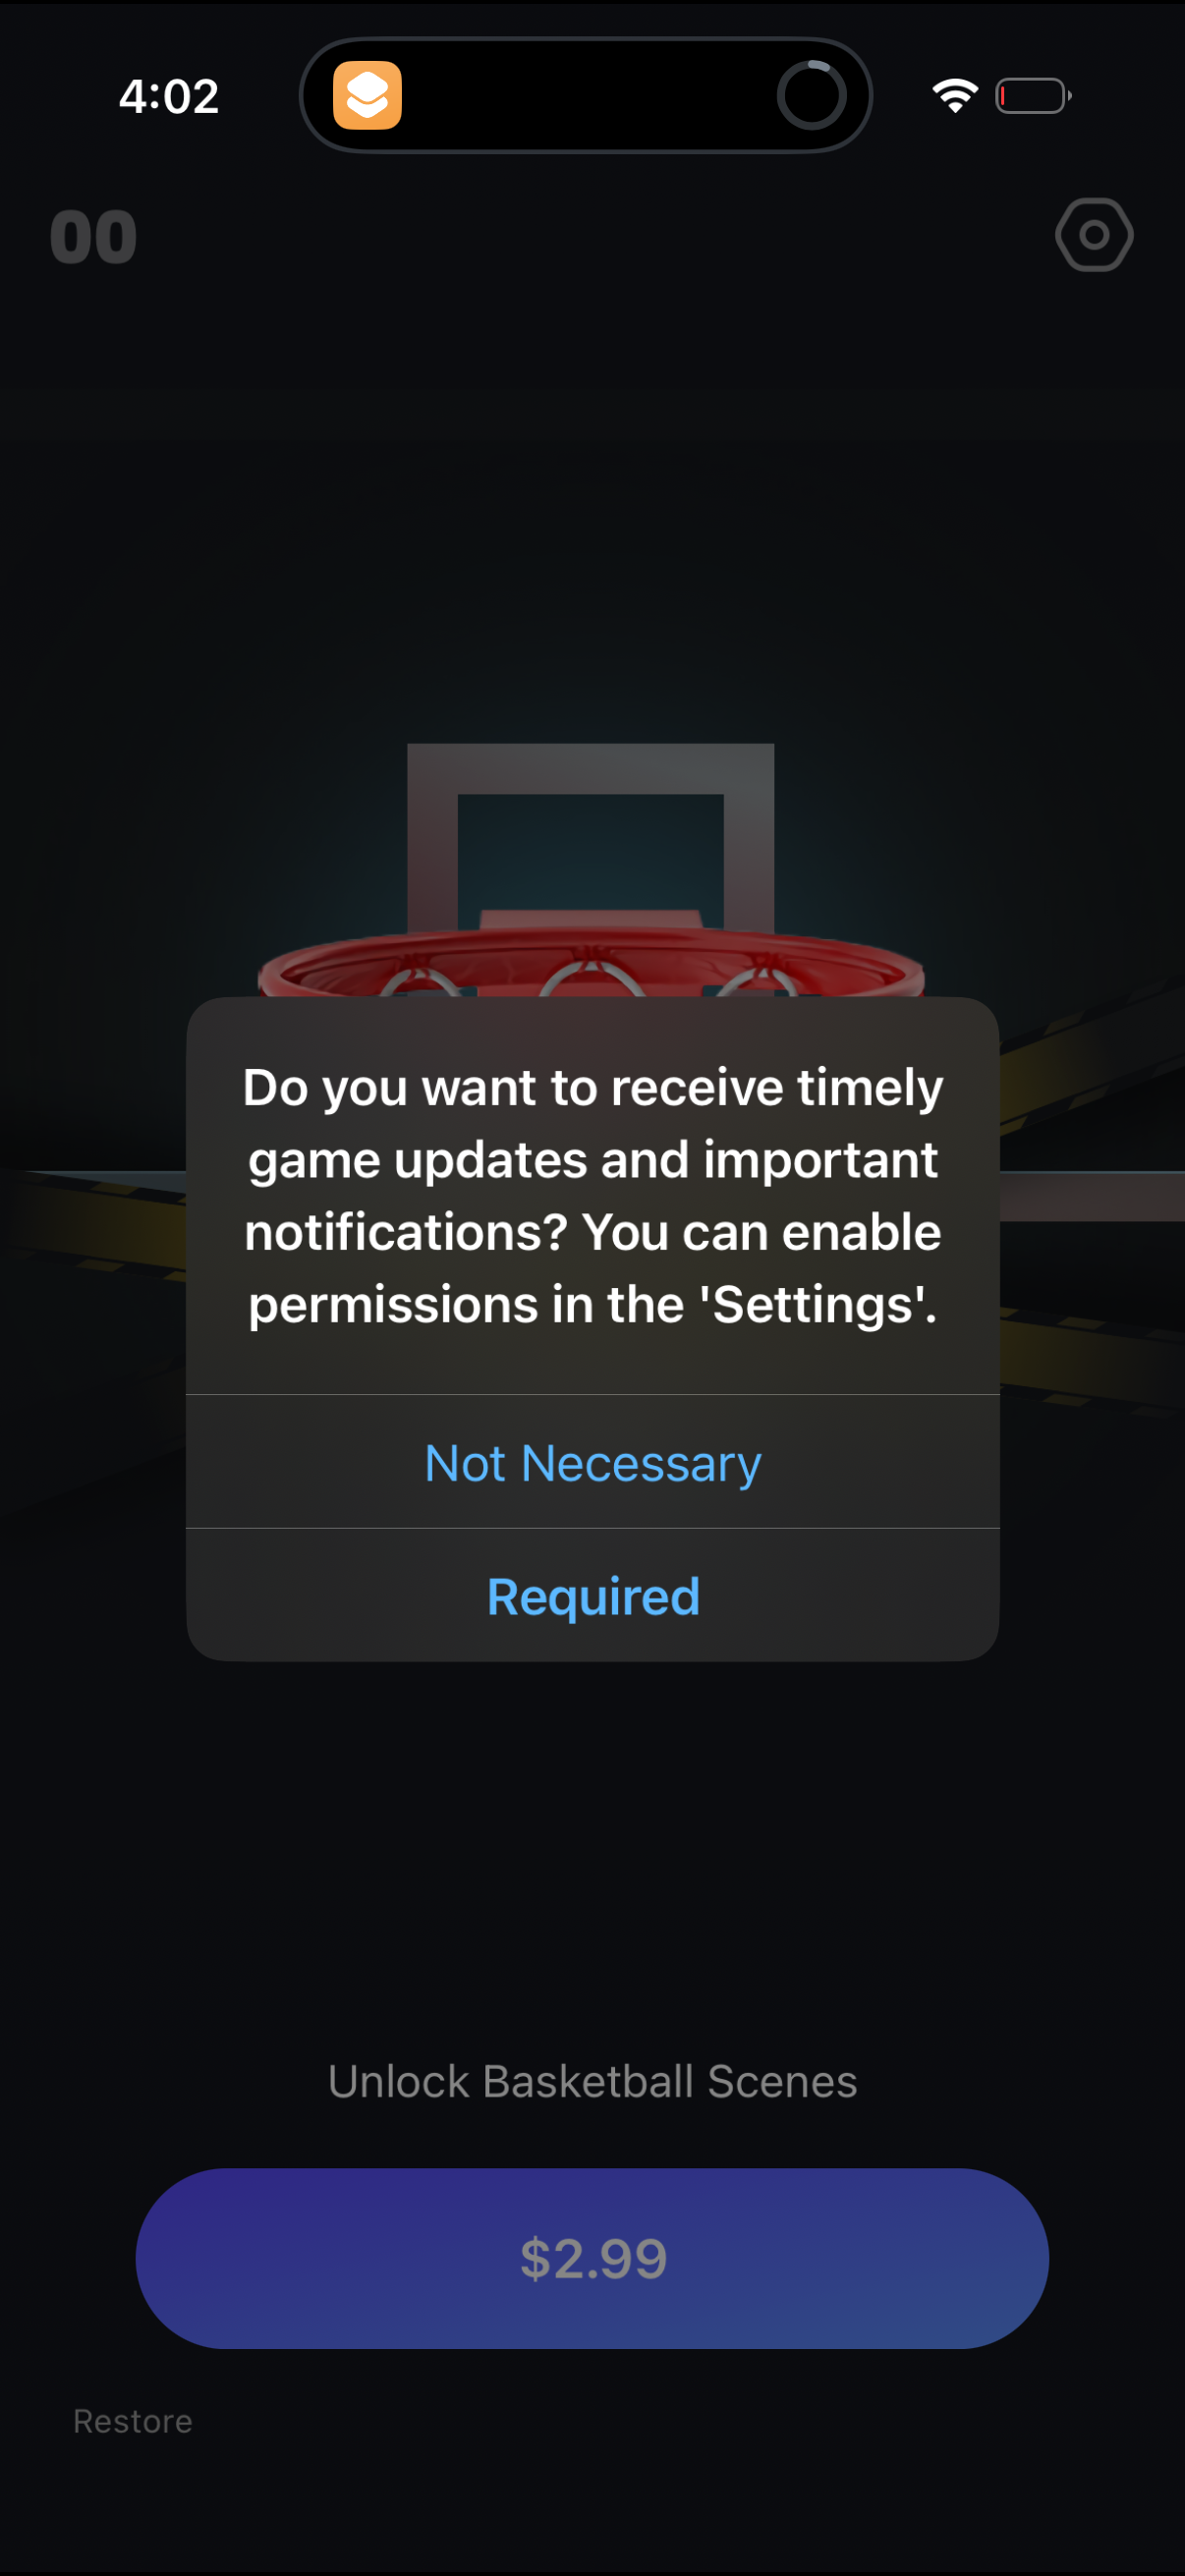
| Item | Hero |
|---|---|
| Annotations | 488 (23.2%) |
| Experiments | 405 |
| Avg impact (1–5) | 3.28 |
| Share scored 4+/5 | 28.1% |
| Platform | 272 web / 216 mobile |
Head to head
Hero vs pricing across the same 2,160-annotation base: [2]
| Hero | Pricing | |
|---|---|---|
| Annotations | 488 (23.2%) | 301 (14.3%) |
| Experiments | 405 | 260 |
| Avg impact (1–5) | 3.28 | 3.53 |
| Share scored 4+/5 | 28.1% | 53.8% |
| Platform | 272 web / 216 mobile | 254 mobile / 47 web |
Hero wins volume; pricing wins impact and is far more concentrated on mobile paywalls. [2][3]
How to decide
Use the platform split as your rule. If your growth surface is a web landing page, the hero is where the field iterates on both platforms and where you can swap a passive fold for a working tool — start there. If you monetize through a mobile subscription paywall, pricing (and offer, which scores higher still) is the field's higher-impact surface, and 84% of pricing iteration happens on mobile. Don't test a web hero if your conversion event is a mobile paywall, and vice versa.
Caveats
Impact is a model-assigned 1–5 score on observed UI diffs, a relative ranking usable at n≥30 — not measured lift. [4] 'Tested more' means the field iterates there more, not that hero tests win less; the two metrics answer different questions. Web pricing is thin (47 annotations), so the pricing story is really a mobile-paywall story.
The numbers
| Stat | Computed from |
|---|---|
| Hero 488 (23.2%) avg impact 3.28, 28.1% 4+; Pricing 301 (14.3%) avg impact 3.53, 53.8% 4+ | statpack area_HERO + area_PRICING + high_impact_share_by_area |
| Hero 488 ann / 405 exp / 272 web / 216 mobile; Pricing 301 ann / 260 exp / 254 mobile / 47 web | statpack area_HERO + area_PRICING |
| Pricing is 84% mobile | statpack area_PRICING + platform_area_split |
| Impact is a model-assigned 1–5 relative score at n≥30, not measured lift | statpack methodology note |
Sources & citations
- [1] Lazyweb Research analysis of 2,160 area annotations, July 2026. Hero vs pricing impact-4+ shares from the n≥30 ranking. ↩
- [2] Lazyweb Research analysis of 789 hero+pricing annotations within 2,160 total, July 2026. Hero 488 / pricing 301; experiment counts and platform splits. ↩
- [3] Lazyweb Research analysis of 2,160 area annotations, July 2026. Pricing is 84% mobile; hero is the only major area balanced across web and mobile. ↩
- [4] Lazyweb Research methodology note, July 2026. Impact is a relative model score on before/after diffs, not measured lift. ↩
Source: Lazyweb Research — proprietary analysis of real, in-market app screens. Cite as Lazyweb Research, 2026-07-07.