Hard Vs Soft Paywall: Which Do Photo & Video Apps Use?
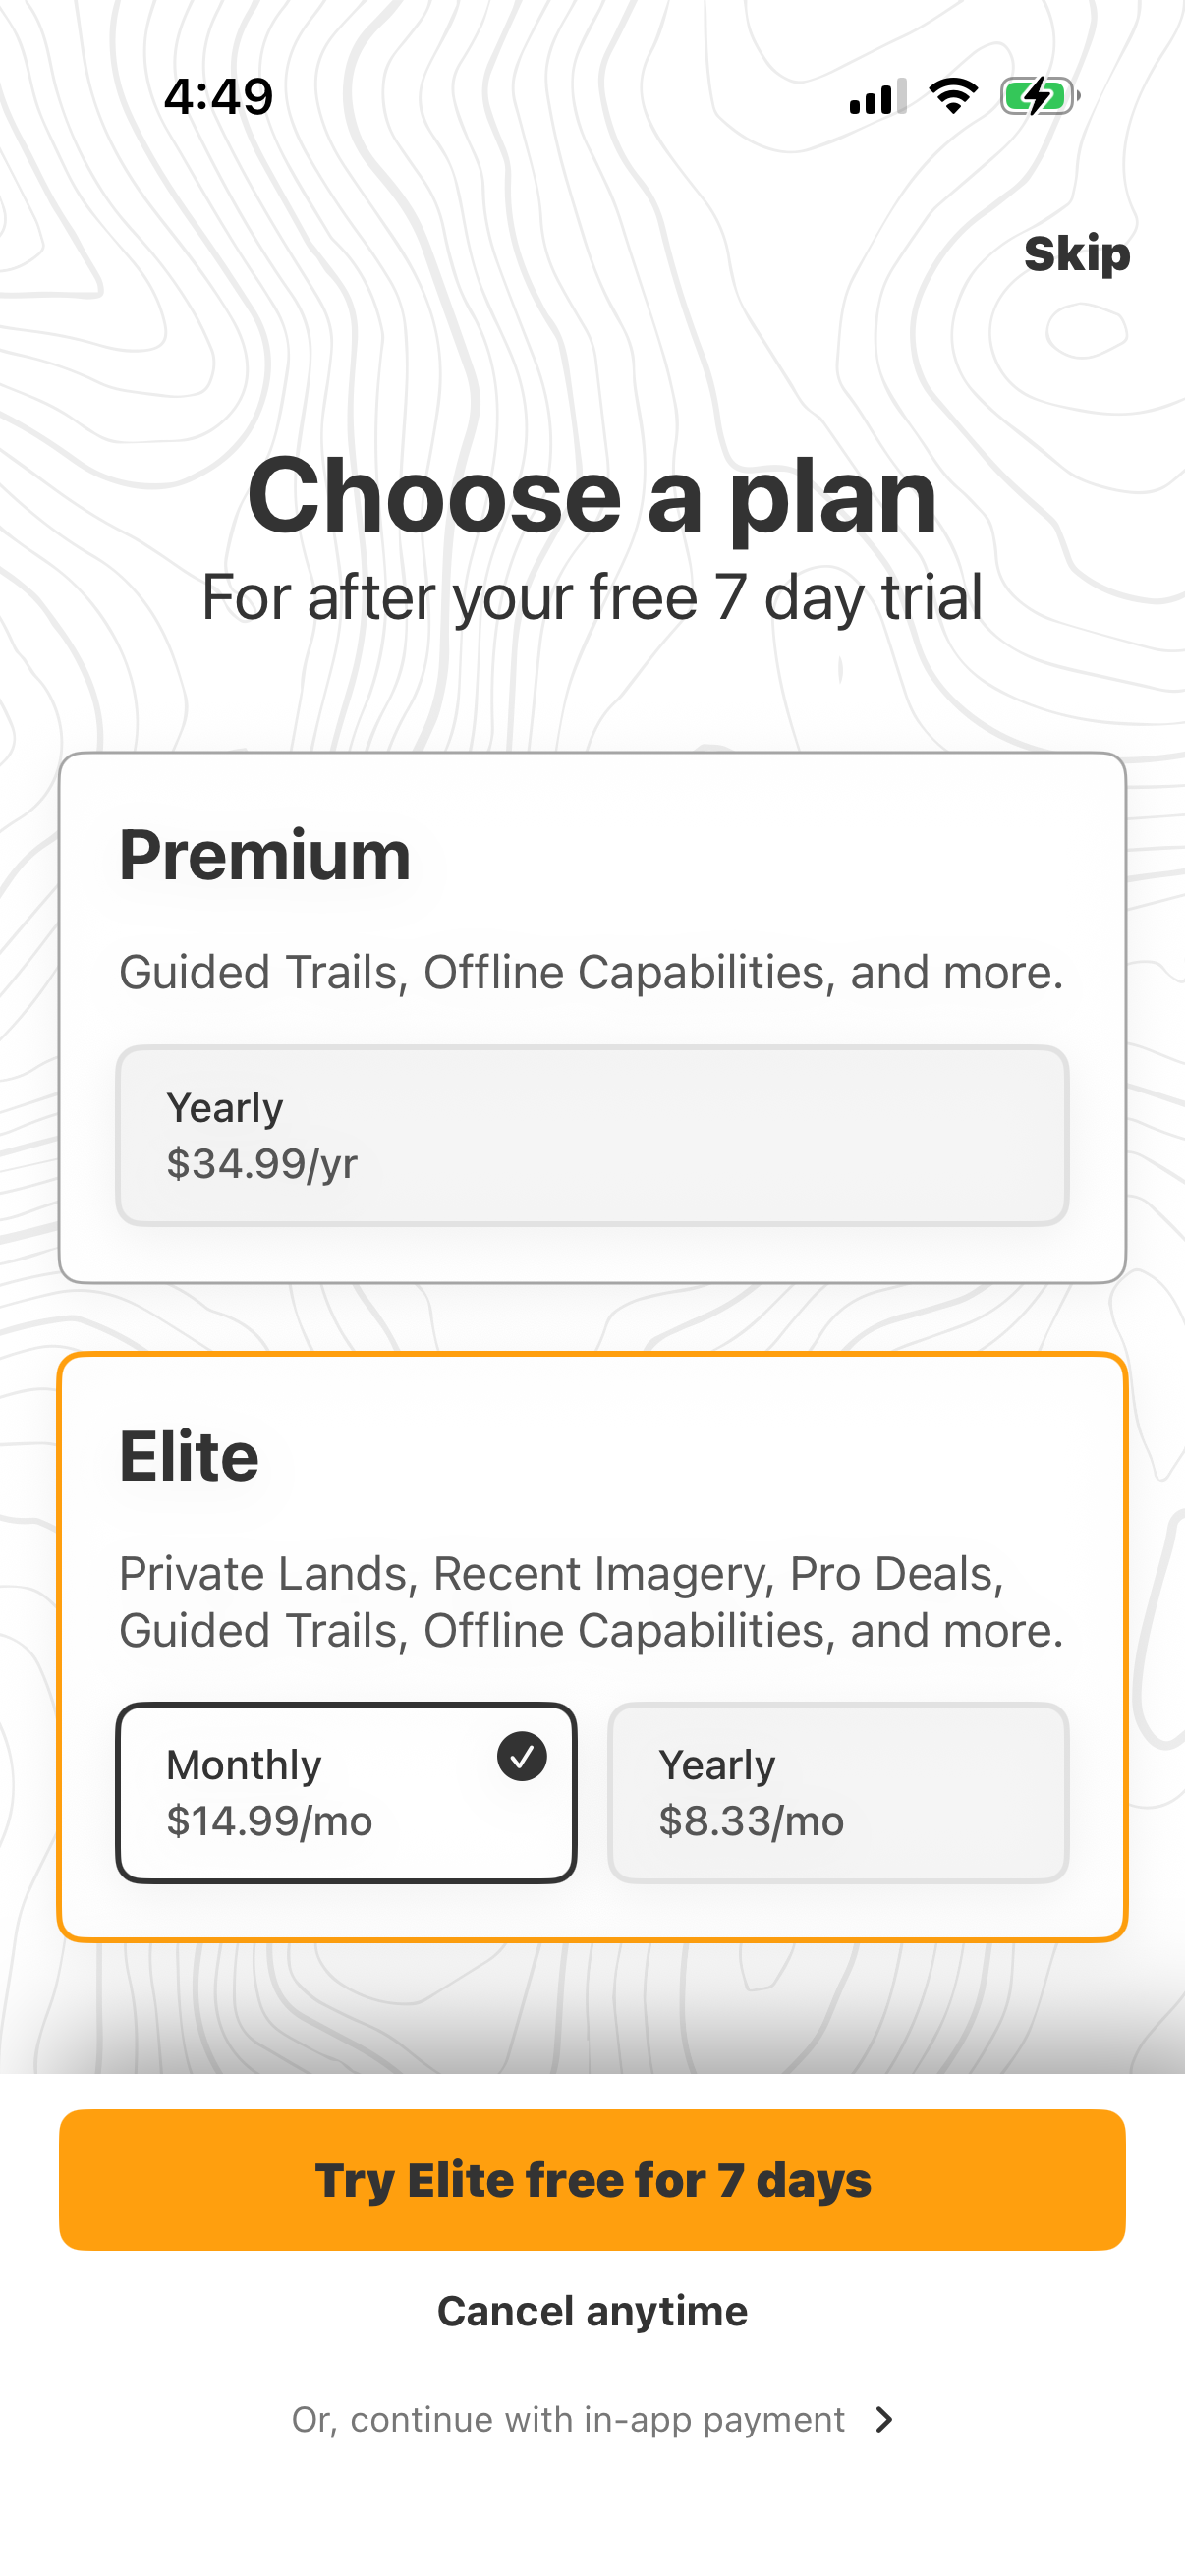
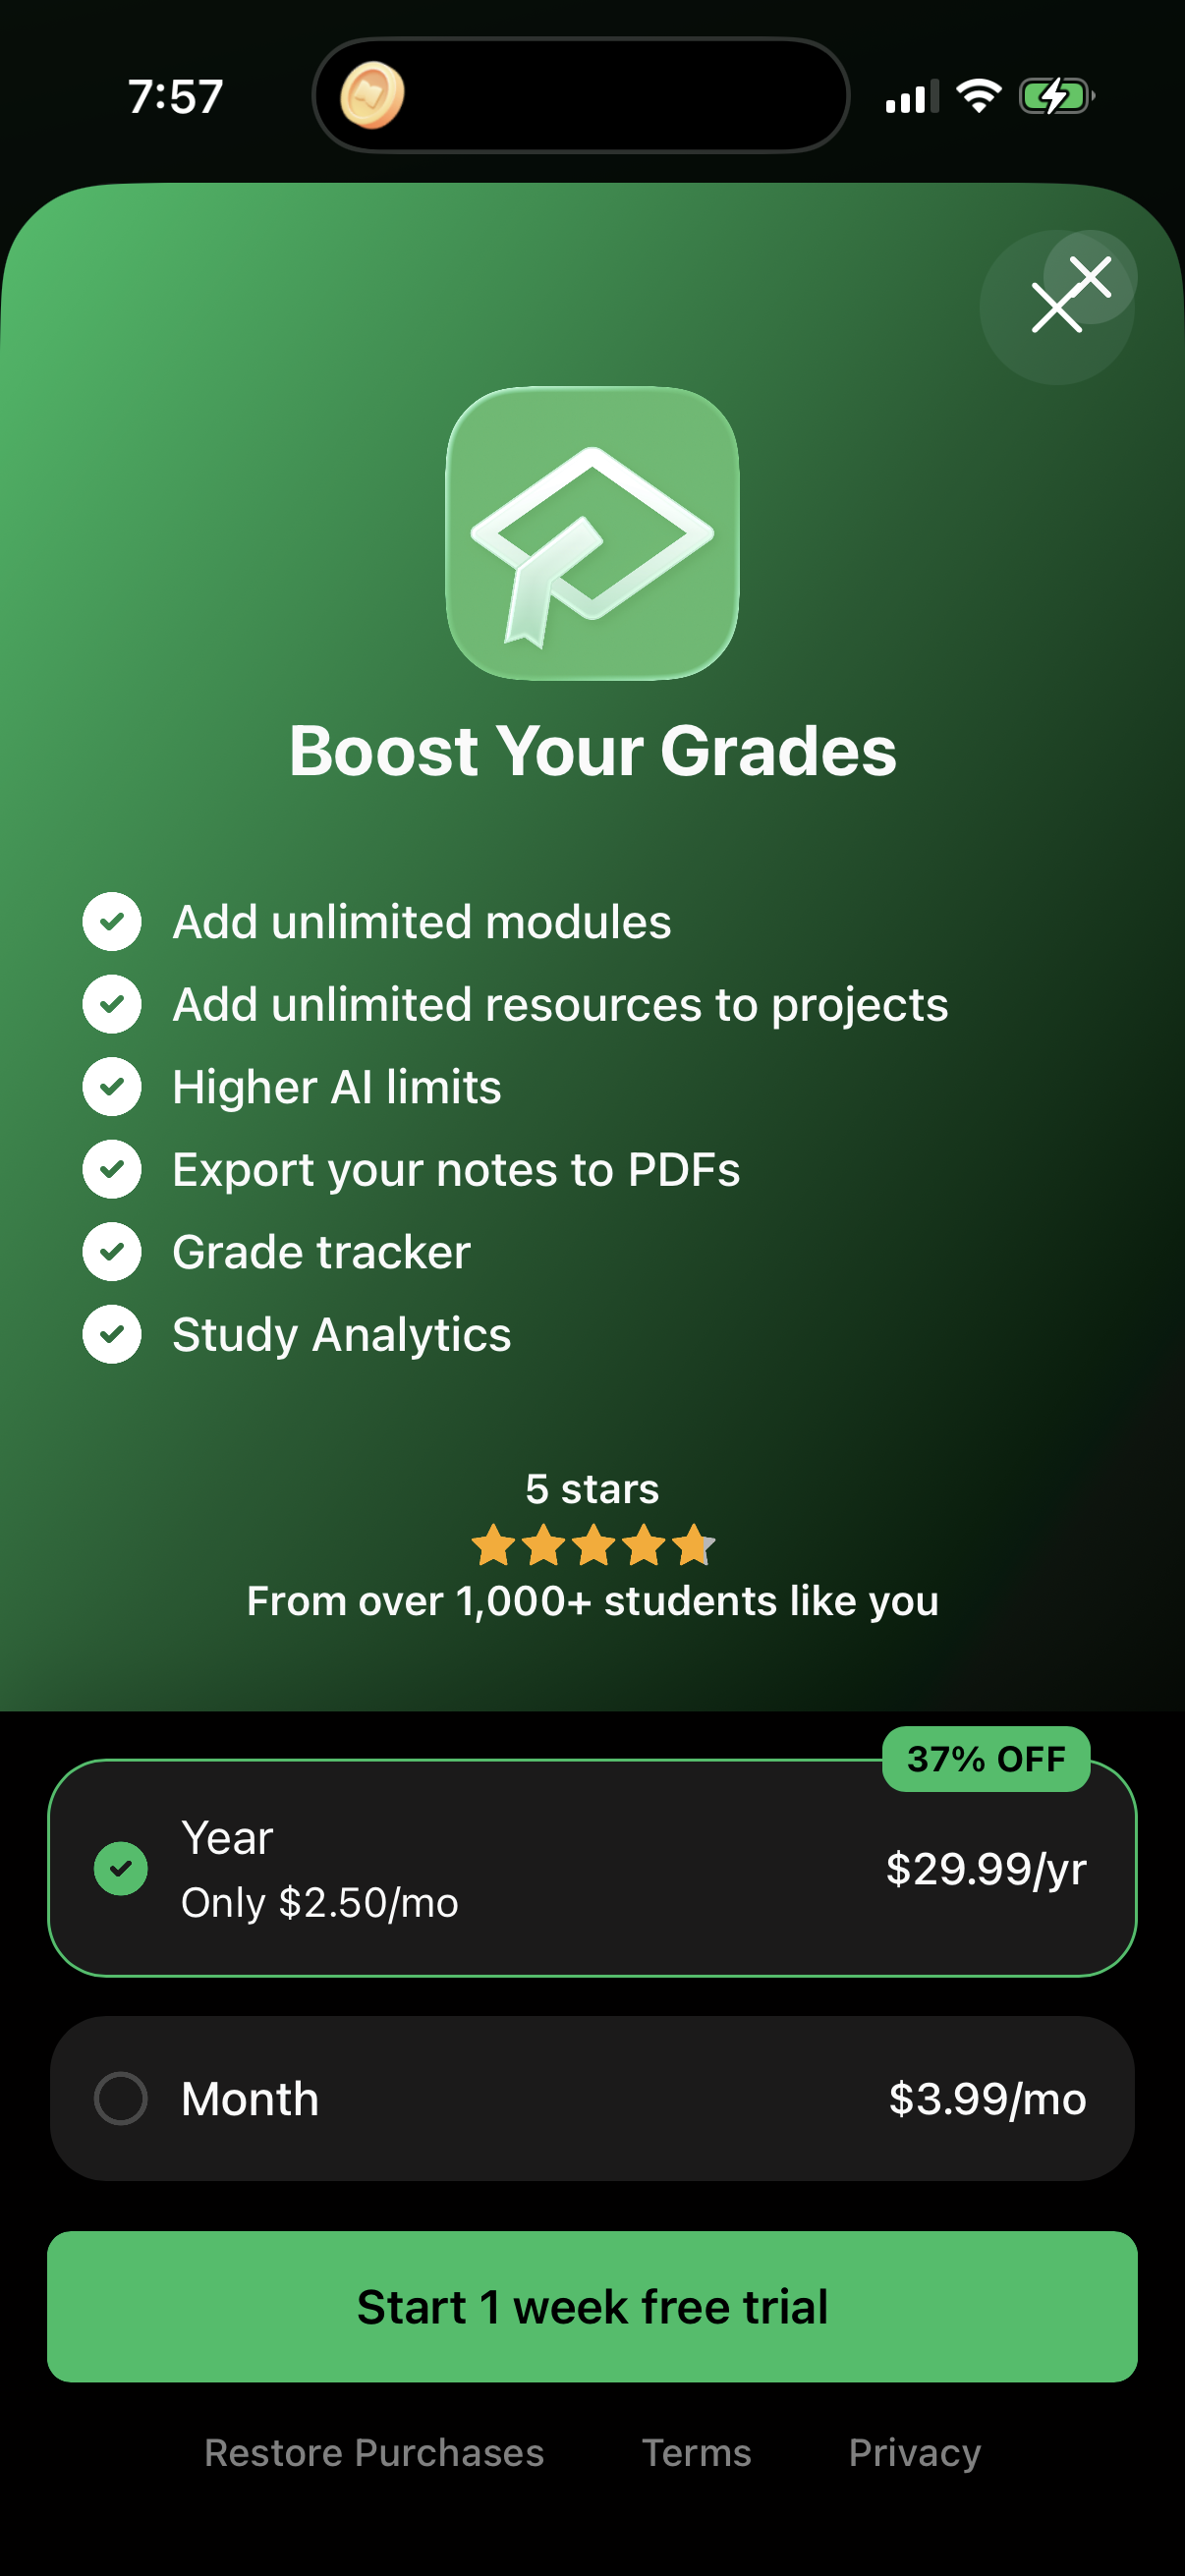
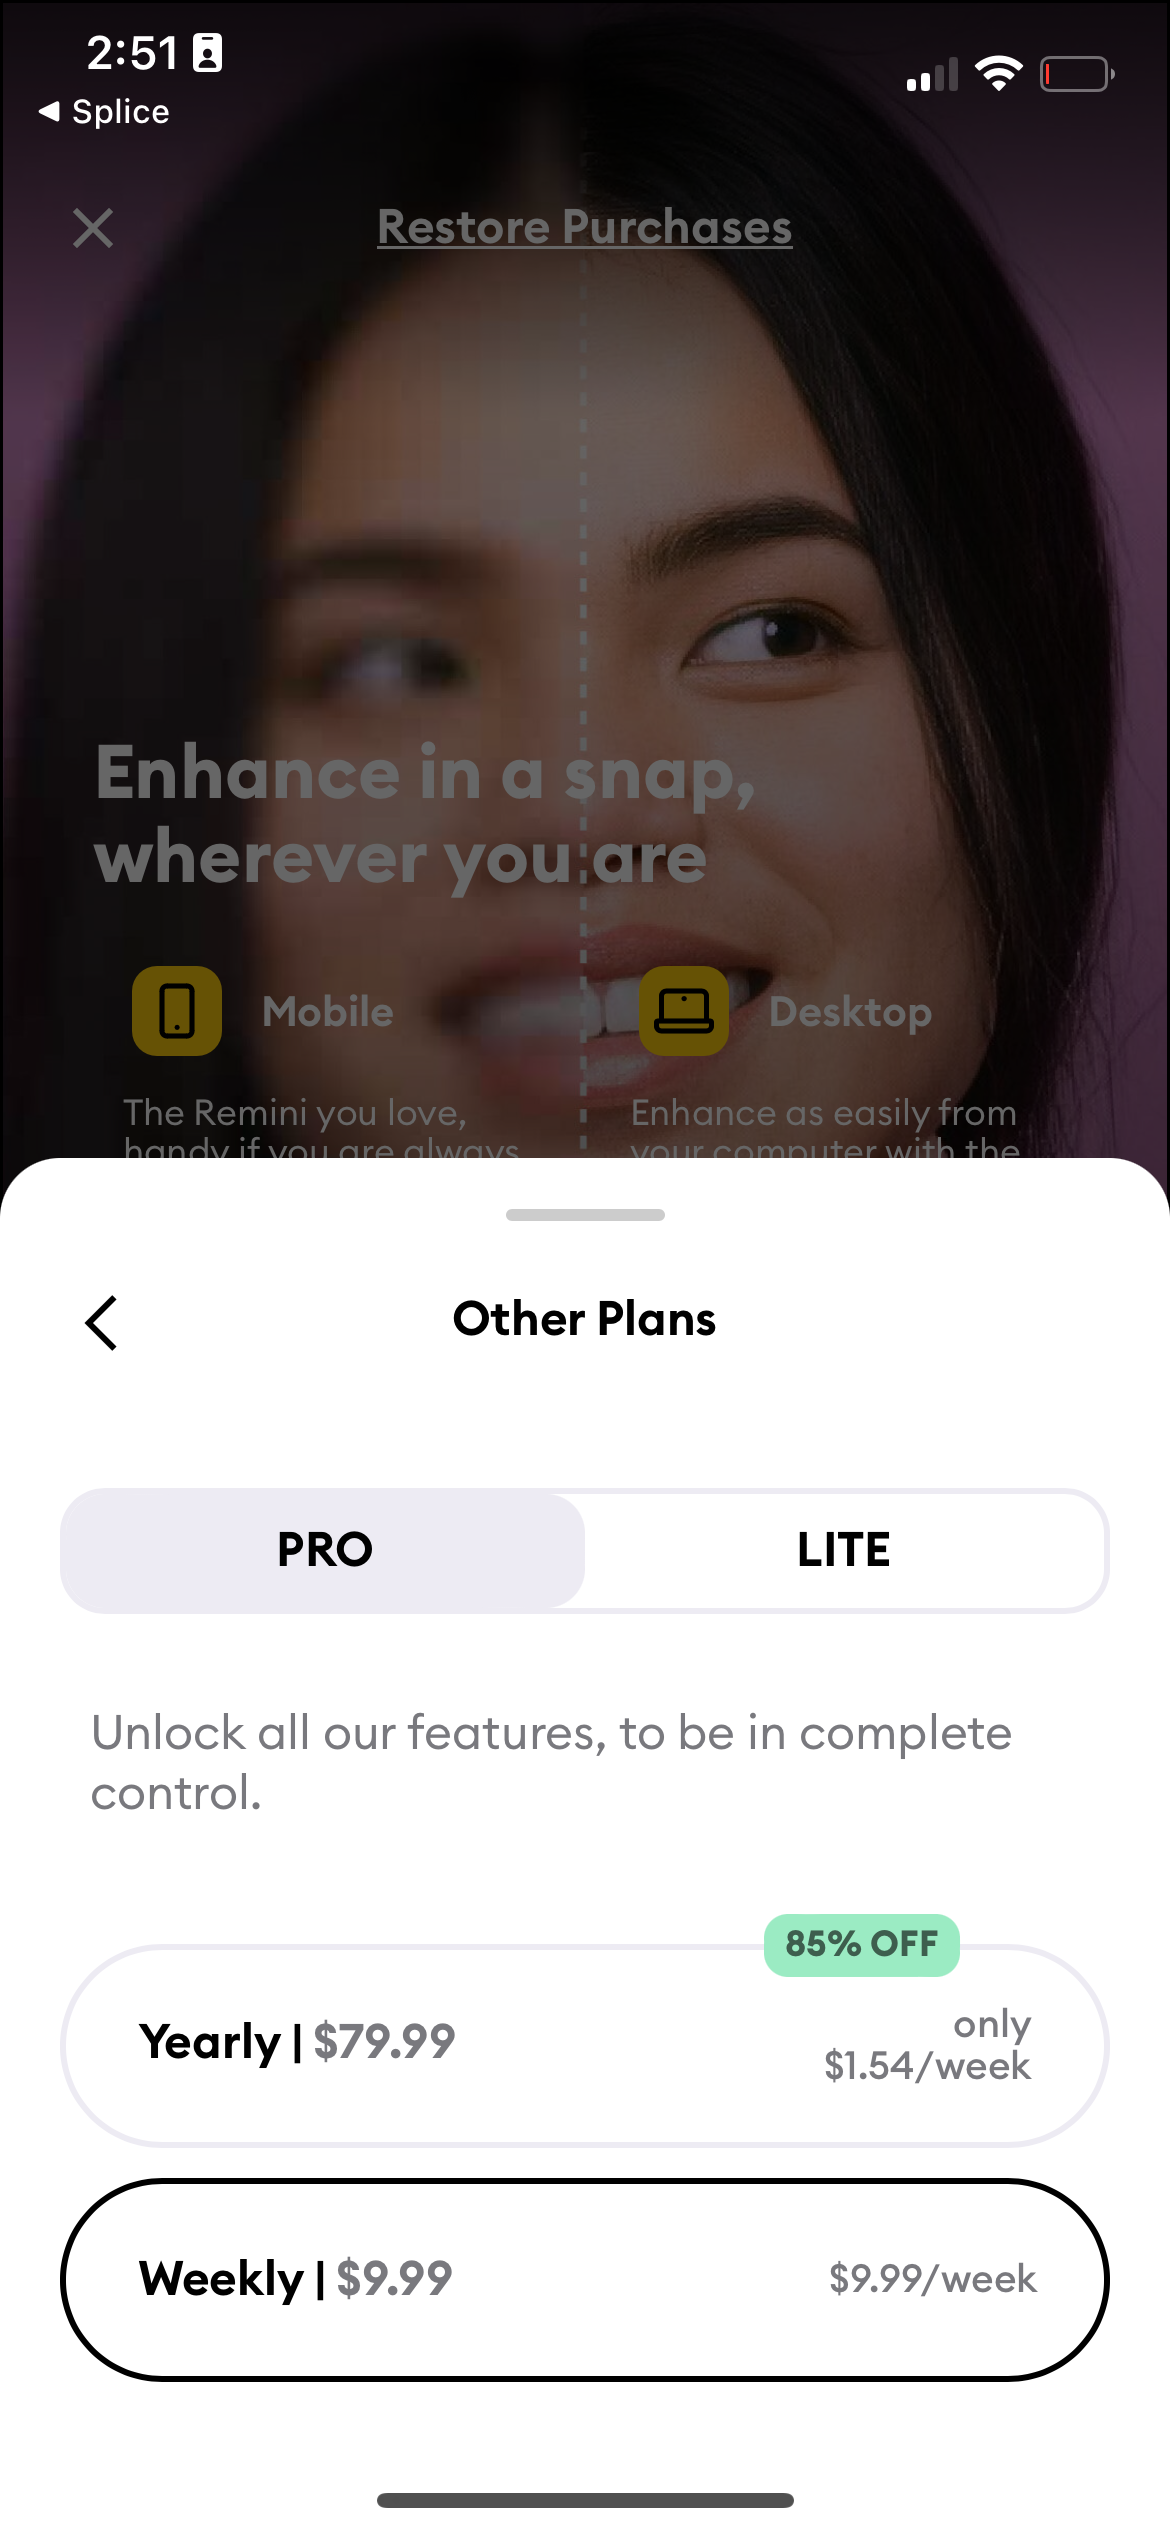
Photo & Video runs the hardest paywalls of the four spec verticals: only 41 of 218 screens (18.8%) show a visible exit, versus the 26.2% corpus average [1][2]. Exits break down to 20 X/close, 11 text-link, and 10 restore-only; 177 screens are hard [1]. The cut covers 16 companies and 218 screens [1].
Only 18.8% of Photo & Video paywall screens (41 of 218) show a visible exit — the hardest spec vertical, Lazyweb Research, July 2026.
| Item | Screens |
|---|---|
| Visible X / close | 20 |
| 'Maybe later' text link | 11 |
| Restore-only | 10 |
| No visible exit (hard) | 177 |
The finding
Across 218 Photo & Video paywall screens from 16 companies, just 41 (18.8%) expose a visible exit — the lowest of the four verticals with enough sample [1][2]. 177 screens (81.2%) are hard [1]. Photo & Video apps lean hardest into the hard-gate default.
Breakdown
| Exit type | Screens |
|---|---|
| Visible X / close | 20 |
| 'Maybe later' text link | 11 |
| Restore-only | 10 |
| No visible exit (hard) | 177 |
Total 218 screens, 16 companies; 41 soft (18.8%) [1]. The three visible-exit types are more evenly split here than in other verticals [1].
How to apply it and caveats
If you ship a photo/video app, a hard gate is the vertical norm — four in five paywalls have no visible exit [1]. This likely reflects instant-value editing tools where a locked export is the paywall trigger. Caveats: 16 companies is the smallest company sample of the four verticals, so read the 18.8% as directional; figures are lower bounds and what-shipped, not lift [1].
The numbers
| Stat | Computed from |
|---|---|
| 41 of 218 P&V screens (18.8%); X 20, text 11, restore 10, hard 177; 16 companies | exit_share_photo_video |
| corpus average 26.2% | screens_with_any_visible_exit: 710/2,708 |
Sources & citations
- [1] Lazyweb Research analysis of 218 Photo & Video paywall screens (mobile app corpus, 16 companies), July 2026. Exit taxonomy filtered to Photo & Video; extraction-based lower bounds; 16 companies is a modest sample. ↩
- [2] Lazyweb Research analysis of 2,708 paywall screens (mobile app corpus), July 2026. All-corpus visible-exit rate for comparison. ↩
Source: Lazyweb Research — proprietary analysis of real, in-market app screens. Cite as Lazyweb Research, 2026-07-07.