Which App Categories Use Light Paywalls Instead of Dark?
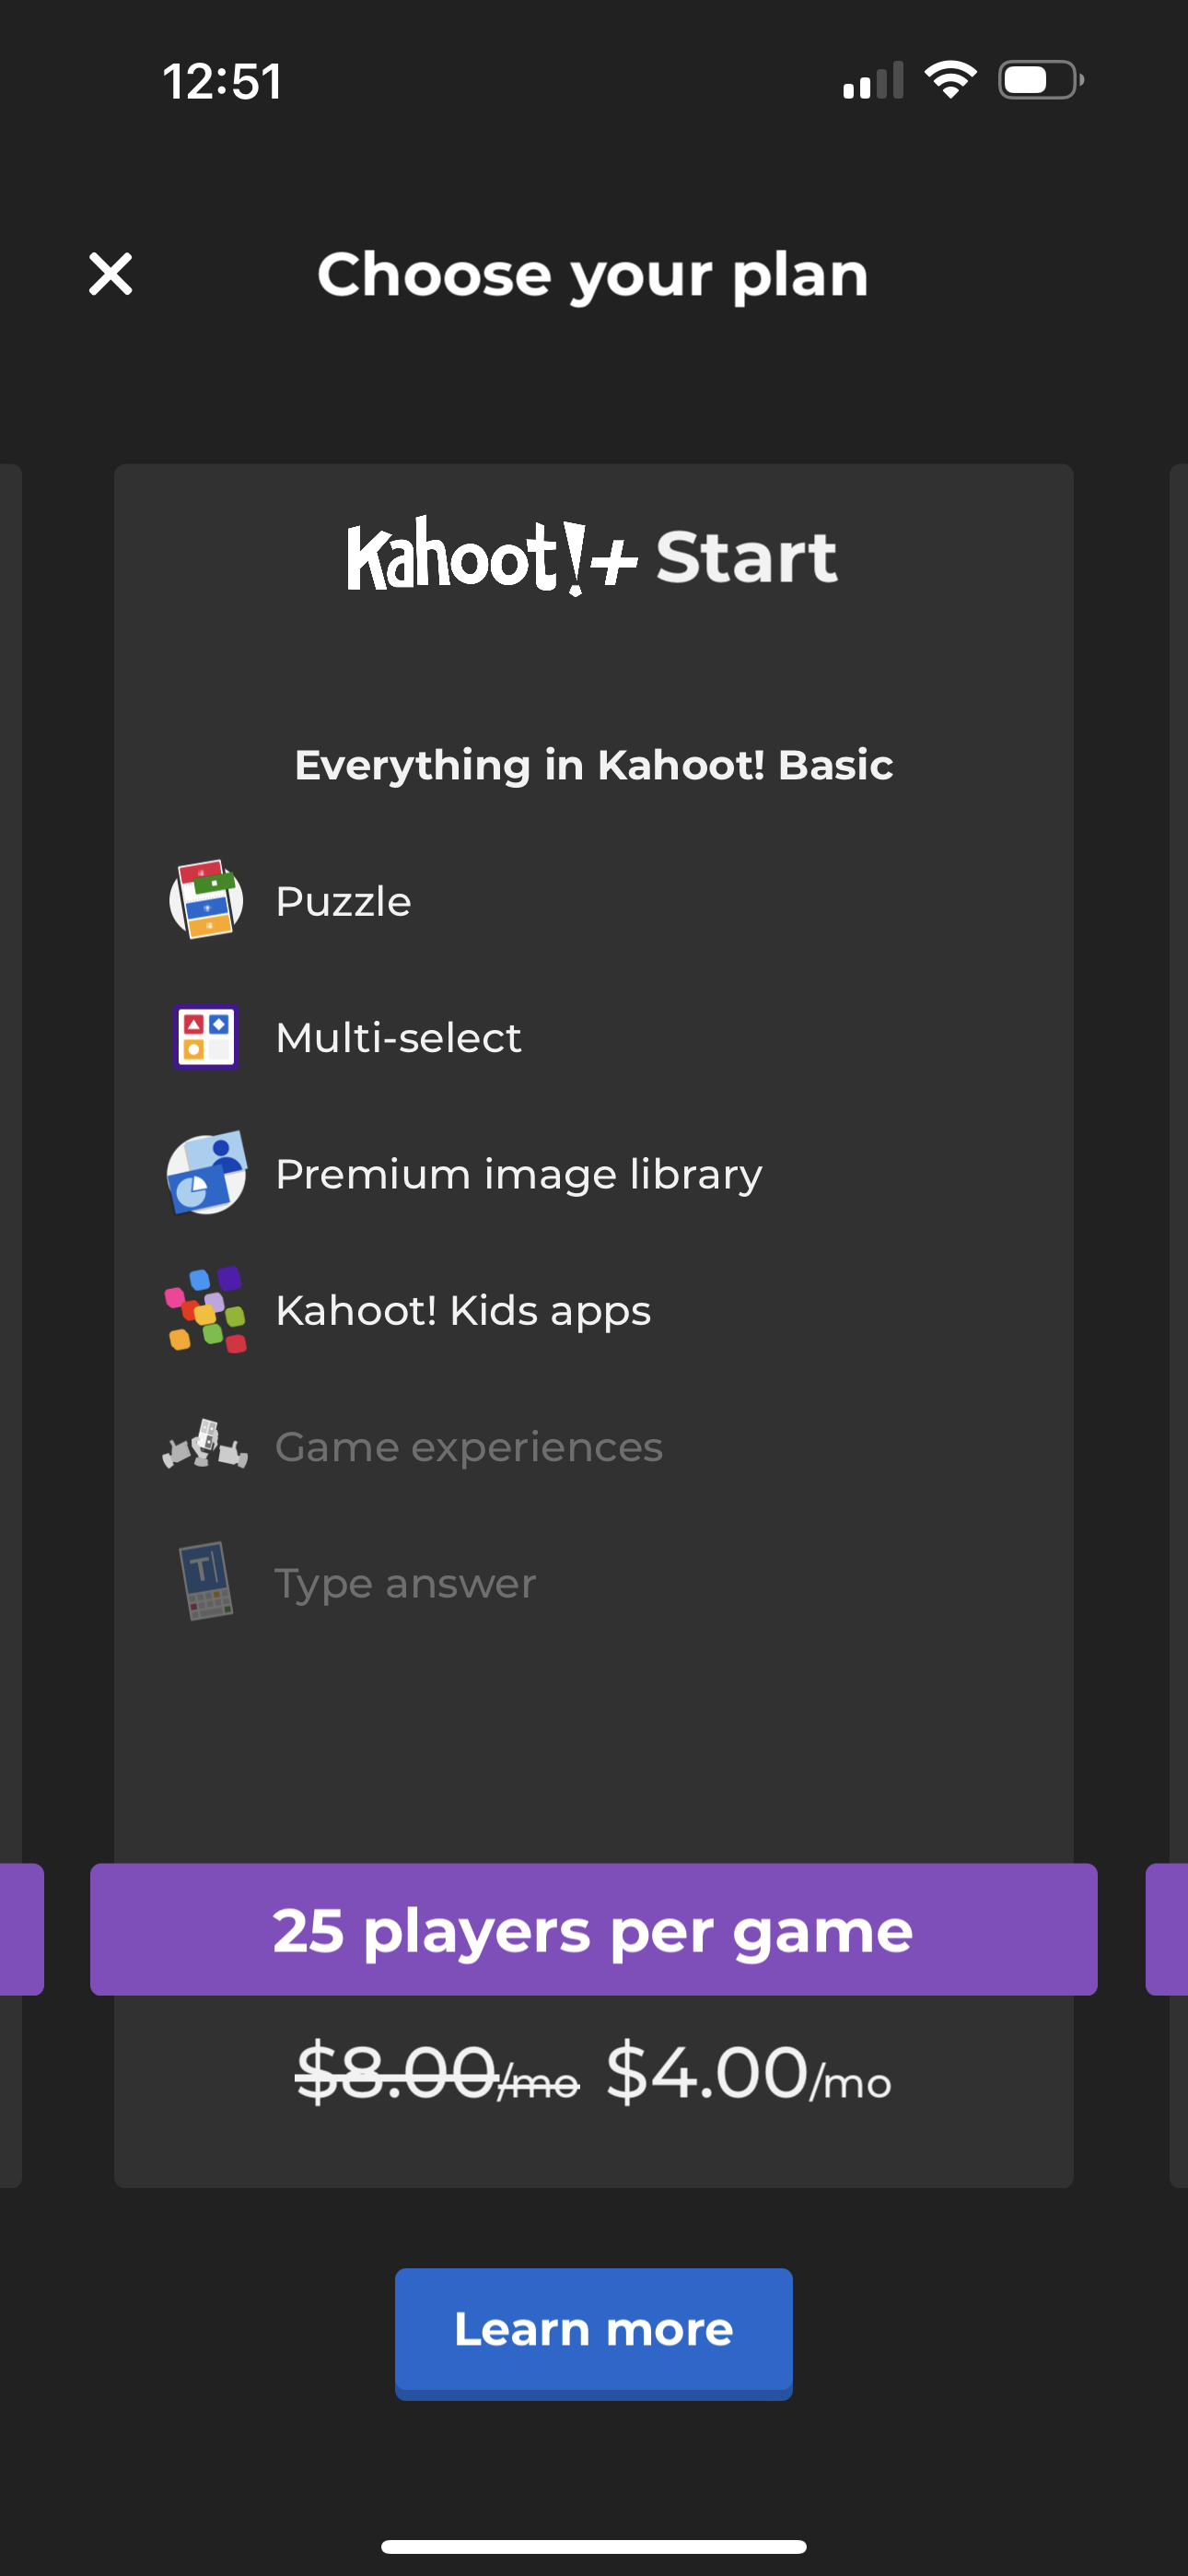
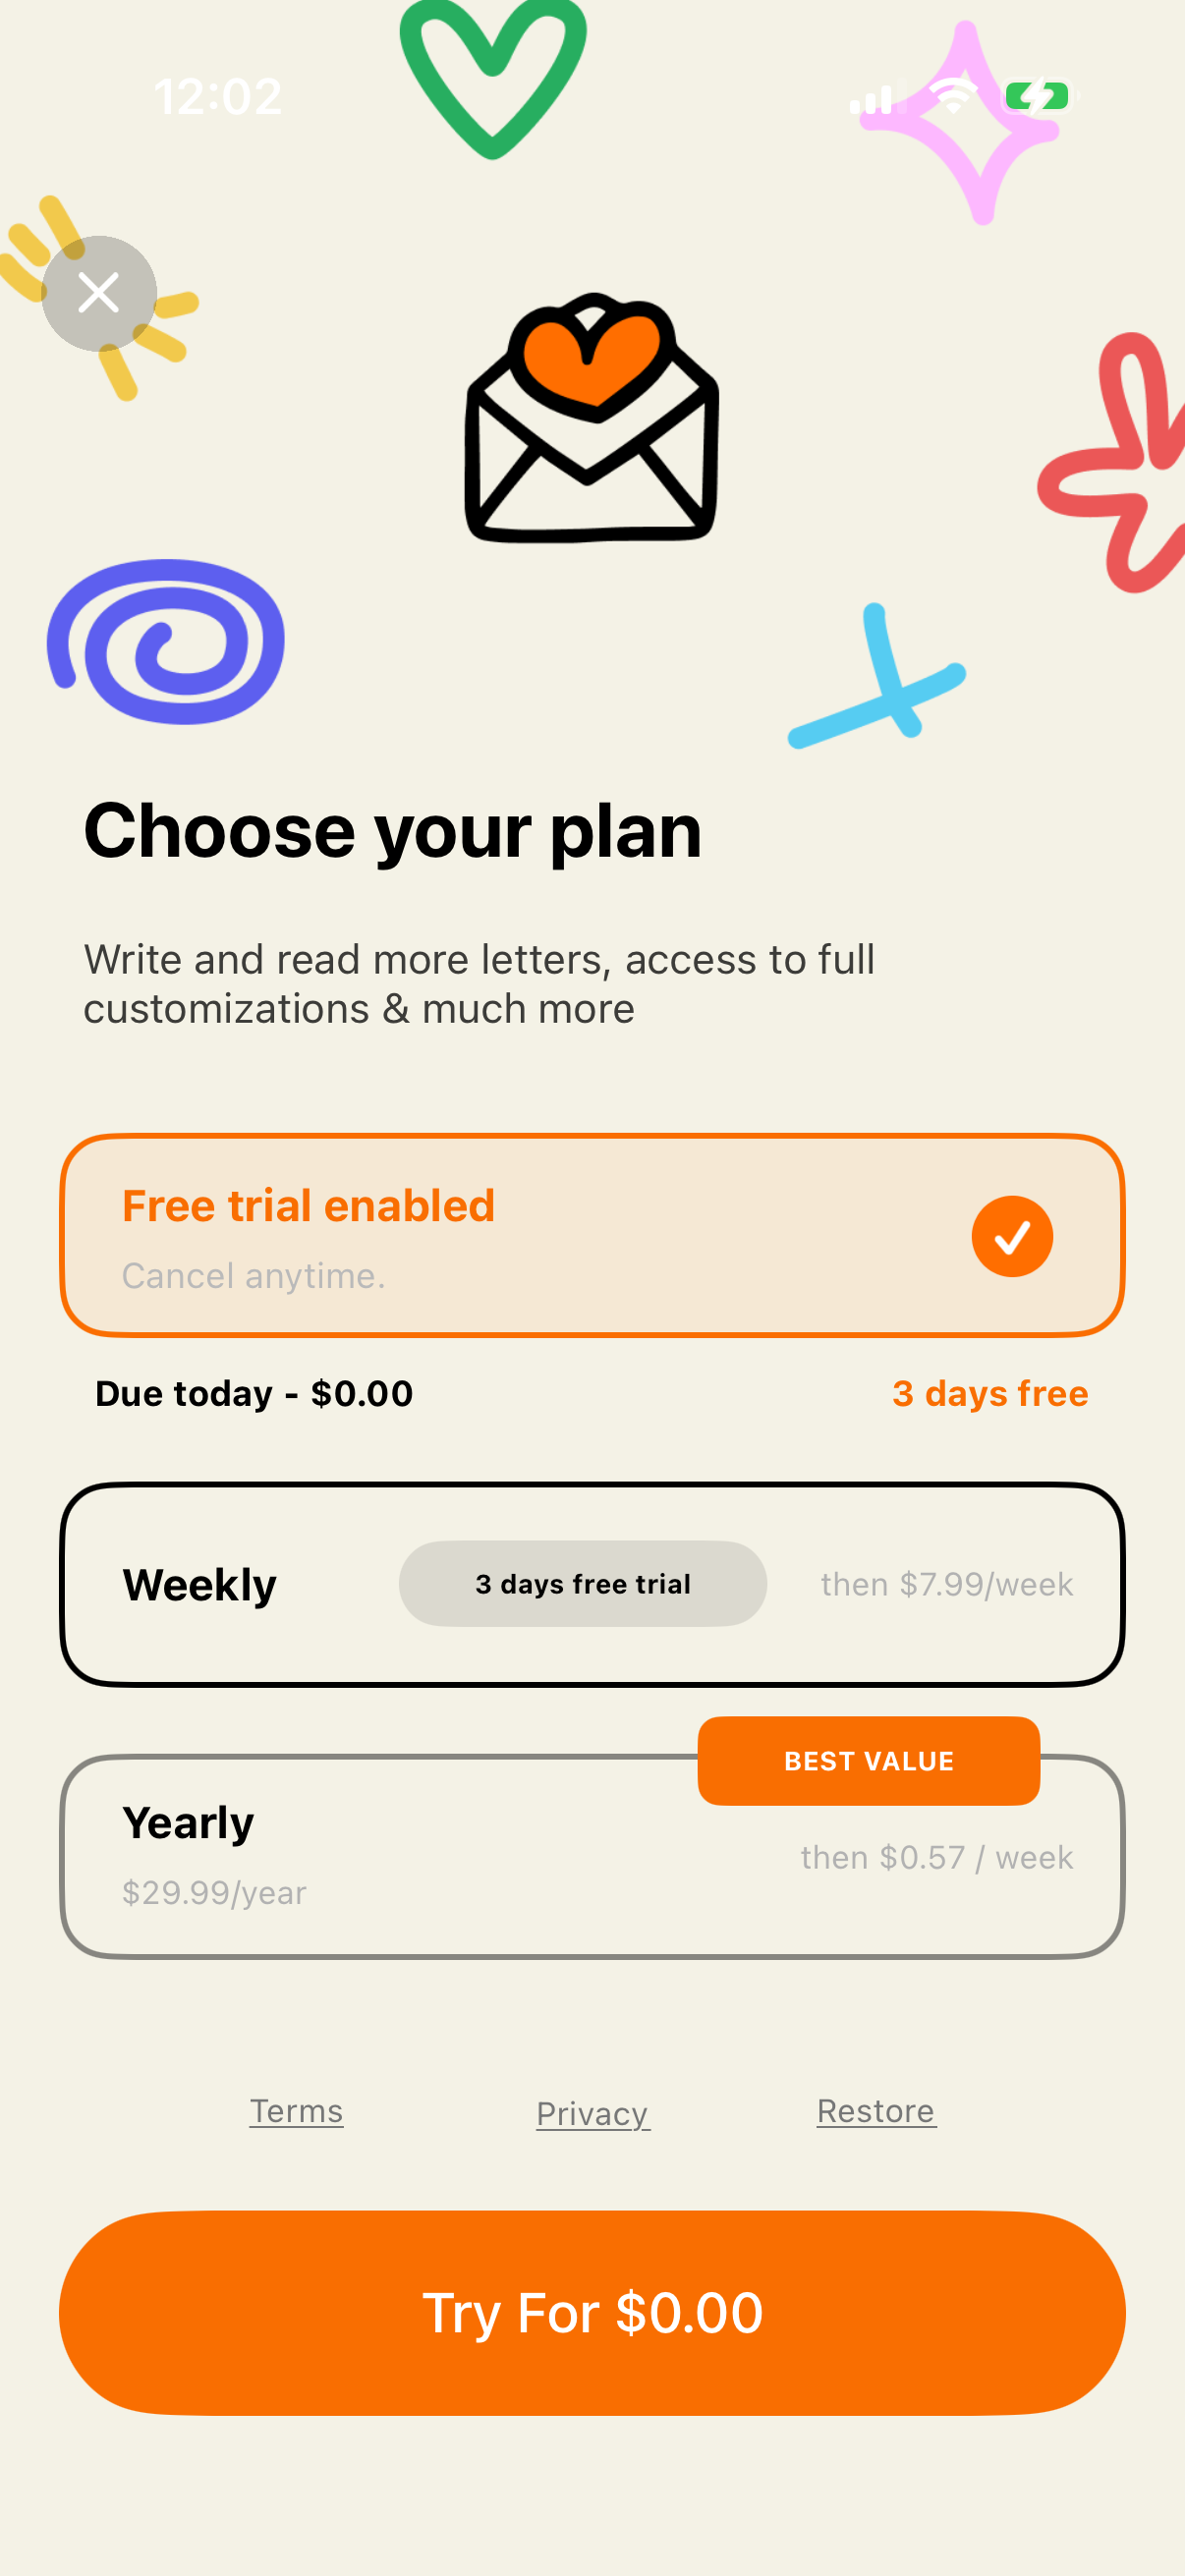
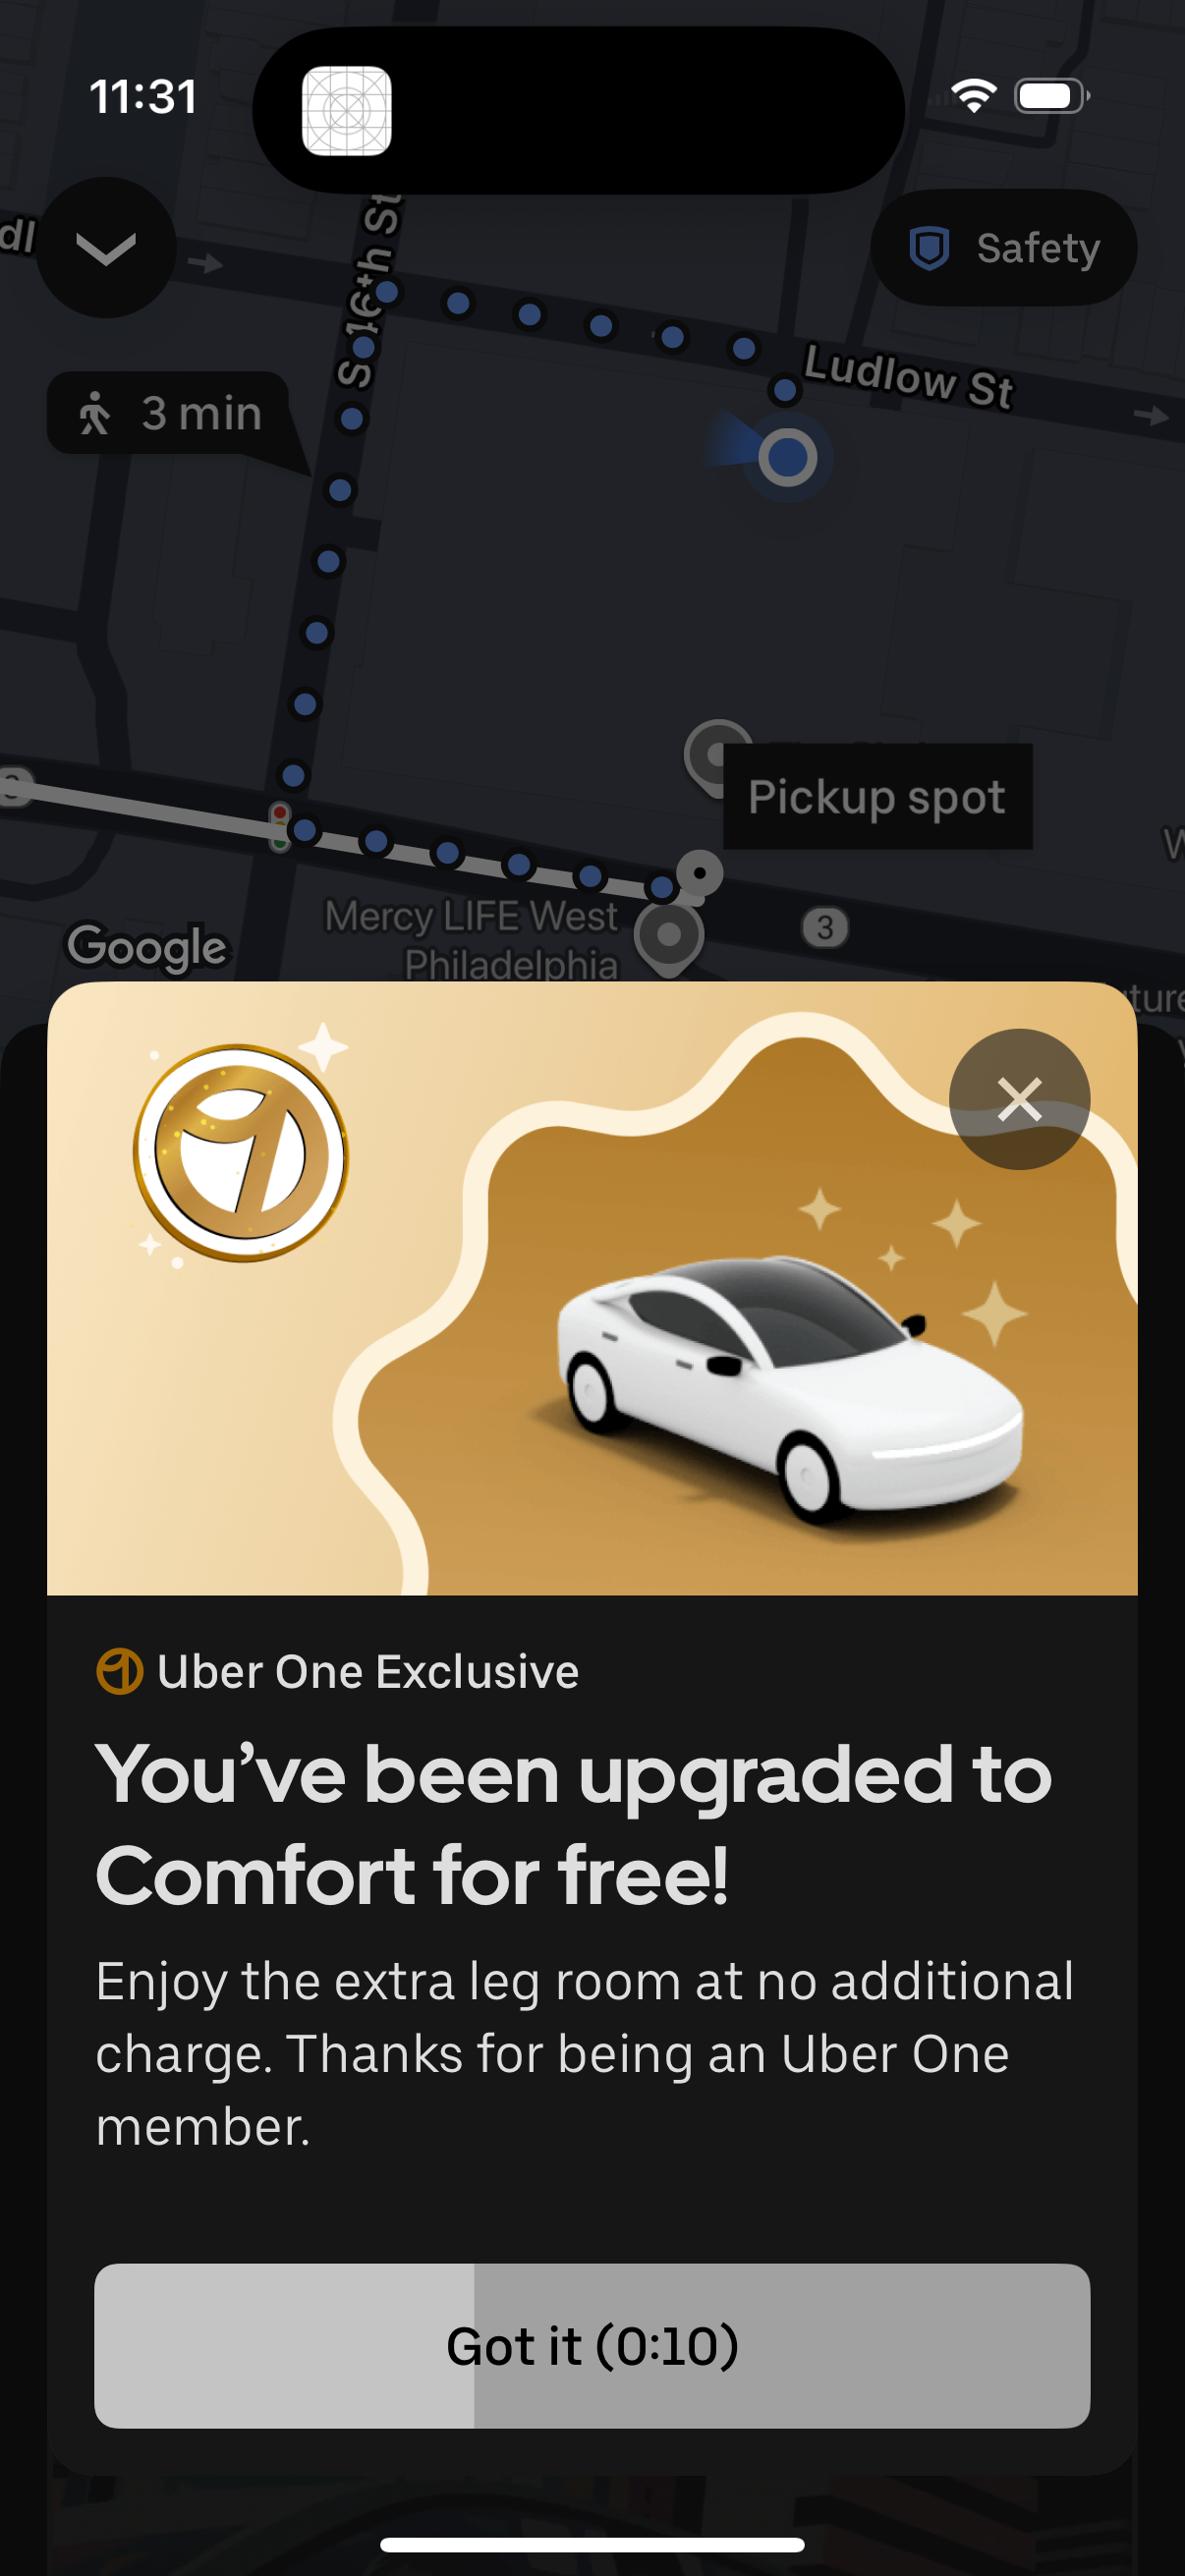
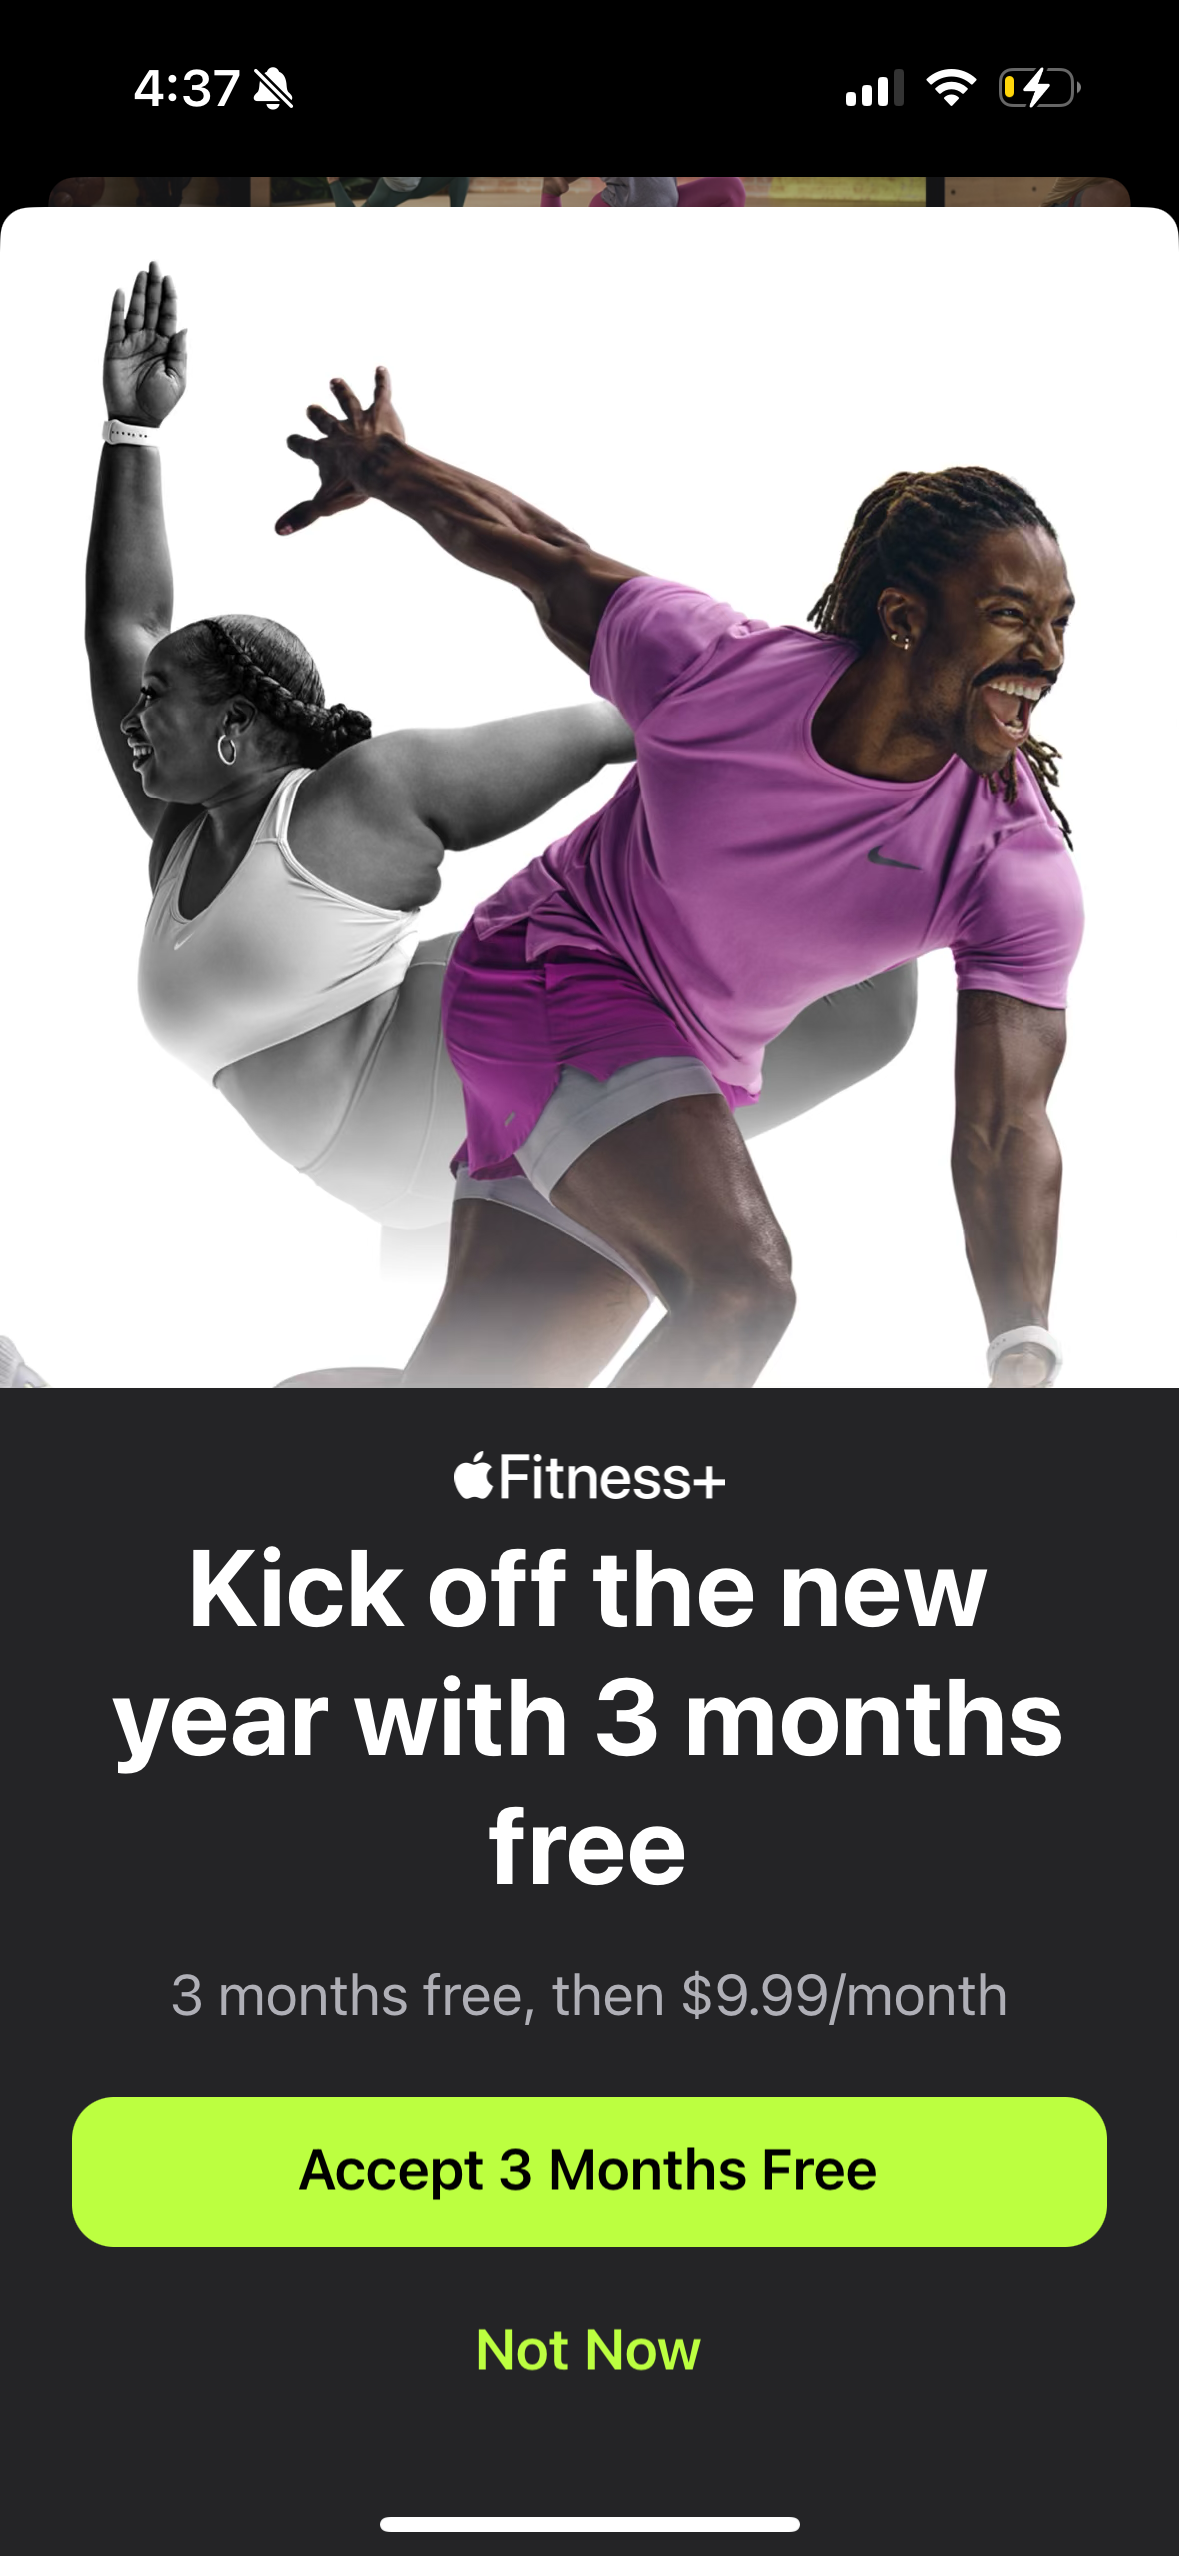
Across five verticals with enough paywalls to compare, dark backgrounds range from 82% in Music down to 56% in Health & Fitness[1][2][3][4]. Health & Fitness is the most light-friendly big vertical; Music, Photo & Video, and Education skew heavily dark[1][2][3][4]. Match your category's convention unless your brand system gives you a reason not to.
Dark-background share of paywalls ranges from 82% (Music, n=72) to 56% (Health & Fitness, n=178) across five tracked verticals (Lazyweb Research, July 2026).
| Item | Dark share |
|---|---|
| Music | 81.9%[1] |
| Photo & Video | 79.1%[2] |
| Education | 78.8%[3] |
| Health & Fitness | 56.2%[4] |
The breakdown by vertical
Classified paywalls per vertical (dark share of classified):
| Category | Paywalls classified | Dark | Dark share |
|---|---|---|---|
| Music | 72 | 59 | 81.9%[1] |
| Photo & Video | 67 | 53 | 79.1%[2] |
| Education | 208 | 164 | 78.8%[3] |
| Health & Fitness | 178 | 100 | 56.2%[4] |
Graphics & Design is shown separately because its sample (47 paywalls) is below the per-vertical percentage threshold: dark 21 vs light 15 in absolute counts[5].
How to apply it
If you build a music, photo, or education paywall, dark is nearly universal (79-82%)[1][2][3] and going light will read as unusual. Health & Fitness is the exception: at 56% dark vs 52 light of 178 classified[4], a light paywall is a mainstream choice there, likely because these apps lean on bright, wellness-coded palettes. Graphics & Design is the most balanced split observed (21 dark, 15 light of 47)[5].
Caveats
Each vertical concentrates in a handful of companies (Music = 13 companies, Photo & Video = 16, Education = 27, Health & Fitness = 37)[1][2][3][4], so one prolific app can shift a vertical's mix. Graphics & Design (47 paywalls, 10 companies) is reported as absolute counts only because it falls below the n>=70 percentage threshold[5]. Backgrounds are classified from vision JSON on one representative screenshot per canonical.
The numbers
| Stat | Computed from |
|---|---|
| Music: 59 dark of 72 classified (81.9%), 13 companies | dark_vs_light_music |
| Photo & Video: 53 dark of 67 classified (79.1%), 16 companies | dark_vs_light_photo_video |
| Education: 164 dark of 208 classified (78.8%), 27 companies | dark_vs_light_education |
| Health & Fitness: 100 dark, 52 light of 178 classified (56.2%), 37 companies | dark_vs_light_health_fitness |
| Graphics & Design: 21 dark, 15 light of 47 (absolute counts; below % threshold), 10 companies | dark_vs_light_graphics_design |
Sources & citations
- [1] Lazyweb Research analysis of 72 classified Music paywall screens (13 companies), July 2026. Music: 74 canonicals, dark 59, light 9, other 4, missing 2. ↩
- [2] Lazyweb Research analysis of 67 classified Photo & Video paywall screens (16 companies), July 2026. Photo & Video: 72 canonicals, dark 53, light 8, other 6, missing 5. ↩
- [3] Lazyweb Research analysis of 208 classified Education paywall screens (27 companies), July 2026. Education: 219 canonicals, dark 164, light 29, other 15, missing 11. ↩
- [4] Lazyweb Research analysis of 178 classified Health & Fitness paywall screens (37 companies), July 2026. Health & Fitness: 189 canonicals, dark 100, light 52, other 26, missing 11. ↩
- [5] Lazyweb Research analysis of 47 Graphics & Design paywall screens (10 companies), July 2026. Below the n>=70 percentage threshold; absolute counts only: dark 21, light 15, other 7, missing 4. ↩
Source: Lazyweb Research — proprietary analysis of real, in-market app screens. Cite as Lazyweb Research, 2026-07-07.