Are mobile paywalls actually declining, or is that a data artifact?
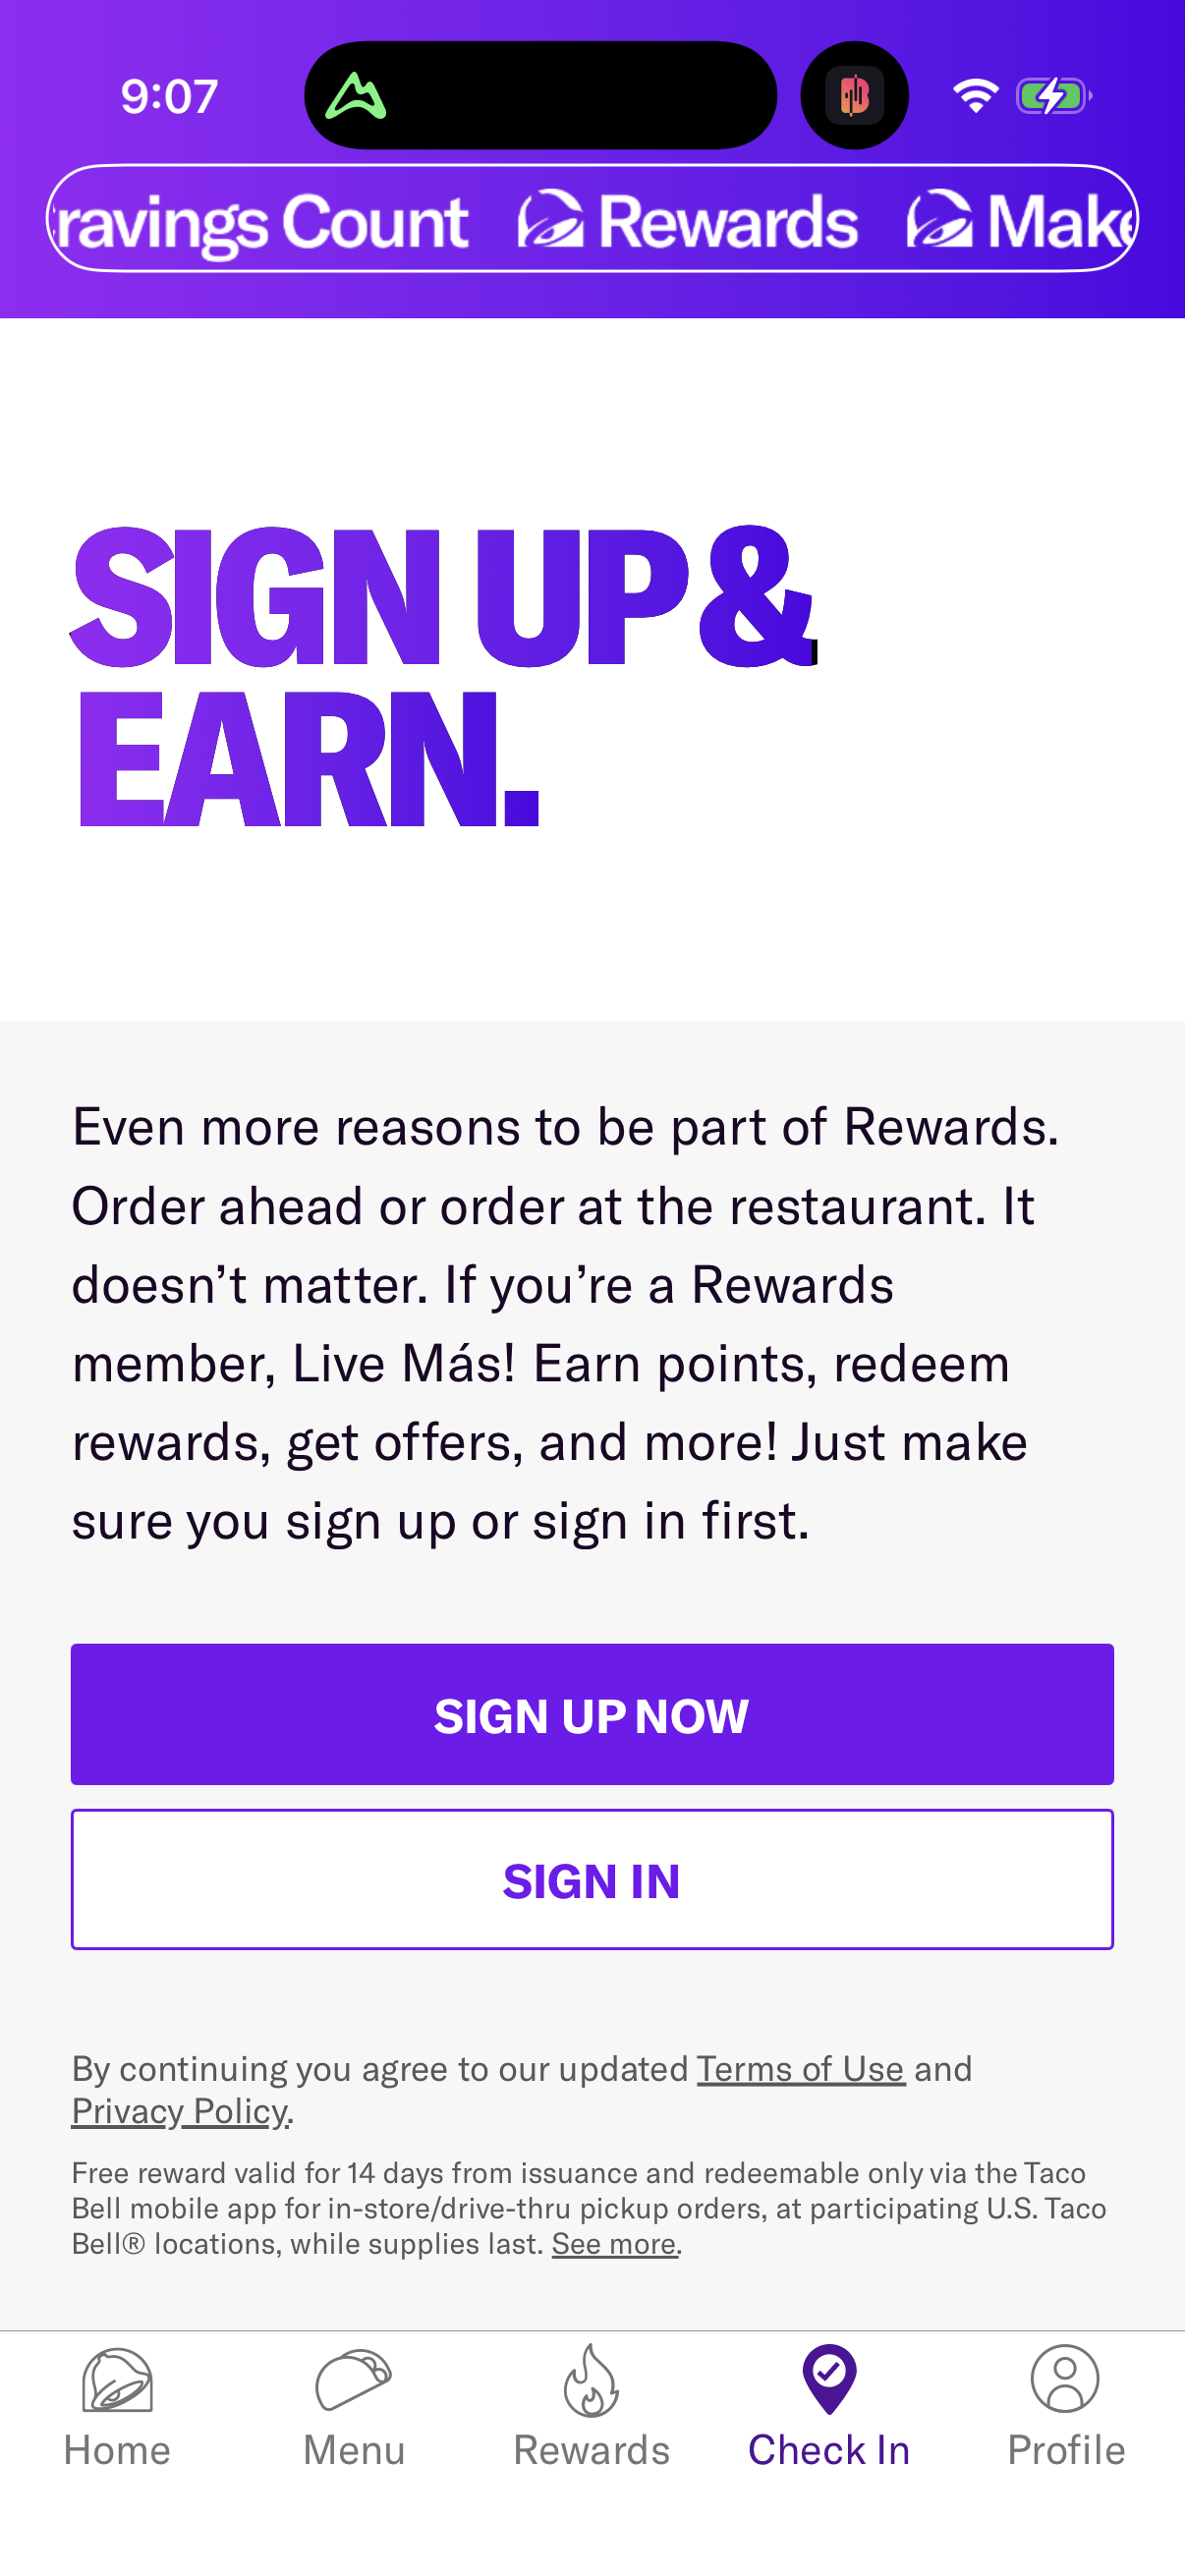
It is almost certainly an artifact, not a real decline. The labeled paywall share falls from 43.7% of captured apps in 2023 to 28.1% in 2025 [1], but that drop is a labeling/coverage artifact: the is_paywall flag is NULL on 21,824 of 23,407 canonical screens, and the 2025 corpus expansion added 17,122 mostly-unlabeled screens that dilute the paywall-labeled share [2]. Do not conclude paywalls are dying - read this as paywall labeling coverage varying by cohort.
Labeled-paywall share fell from 43.7% to 28.1% of captured apps 2023-2025, but is_paywall is NULL on 21,824 of 23,407 canonical screens - a coverage artifact, not a decline (July 2026).


| Item | Labeled share |
|---|---|
| 2023 | 43.7% [1] |
| 2024 | 42.4% [1] |
| 2025 | 28.1% [1] |
| 2026 (partial) | 27.4% [1] |
What the raw numbers show - and why not to trust them
Share of captured apps with an is_paywall=true canonical screen, by capture year:
| Capture year | Companies with labeled paywall | Cohort size | Labeled share |
|---|---|---|---|
| 2023 | 128 | 293 | 43.7% [1] |
| 2024 | 169 | 399 | 42.4% [1] |
| 2025 | 205 | 730 | 28.1% [1] |
| 2026 (partial) | 177 | 647 | 27.4% [1] |
Taken at face value this looks like a decline. It is not safe to read that way [2].
Why it is a labeling artifact
The is_paywall flag is NULL on 21,824 of 23,407 canonical rows - the vast majority of screens are simply unlabeled for paywall status [2]. The 2025 corpus expansion added 17,122 new canonical screens, most of them unlabeled, which mechanically dilutes the share of screens carrying a positive paywall label [2]. So the denominator grew with unlabeled screens while the labeled numerator did not keep pace - producing an apparent drop that reflects coverage, not user-facing reality.
How to apply it
Do not cite 'paywalls are declining' from this data. If you need the direction of paywall prevalence, treat this metric as unusable and lean instead on the paywall-adjacent trends that are tag-based and reliable - countdown-timer urgency (10.1% in 2025) and social proof (53.3%) both sit on paywall and pre-paywall screens [3]. The honest takeaway for a growth PM: labeling coverage is uneven by cohort, so trust tag-based prevalence over the is_paywall flag for time series.
Caveats
This entire page is a caution page: the is_paywall coverage gap (21,824/23,407 NULL) makes the year-over-year labeled share uninterpretable as a real trend [2]. Prevalence is deduped by distinct company [1]. Partial-2026 is a thin-capture year and doubly unreliable here [1].
The numbers
| Stat | Computed from |
|---|---|
| Labeled paywall share 43.7% (2023, 128/293) -> 42.4% (2024, 169/399) -> 28.1% (2025, 205/730) -> 27.4% (2026 partial, 177/647) | paywall_screen_prevalence_over_time_CAUTION |
| is_paywall NULL on 21,824 of 23,407 canonical rows; 2025 added 17,122 mostly-unlabeled canonical screens | paywall_screen_prevalence_over_time_CAUTION / smallSampleWarnings |
| Reliable tag-based comparisons: countdown timer 10.1% (2025), social proof 53.3% (2025) | countdown_timer_prevalence_over_time / social_proof_prevalence_over_time |
Sources & citations
- [1] Lazyweb Research analysis of 809 tracked apps (mobile-app corpus, 23,407 canonical screens), July 2026. Share of companies captured each year with an is_paywall=true canonical screen, deduped by company_name. ↩
- [2] Lazyweb Research analysis of 809 tracked apps (mobile-app corpus, 23,407 canonical screens), July 2026. is_paywall is NULL on 21,824/23,407 canonical rows; 2025 added 17,122 mostly-unlabeled canonical screens - the apparent decline is a coverage artifact. ↩
Source: Lazyweb Research — proprietary analysis of real, in-market app screens. Cite as Lazyweb Research, 2026-07-07.