Stock details
1
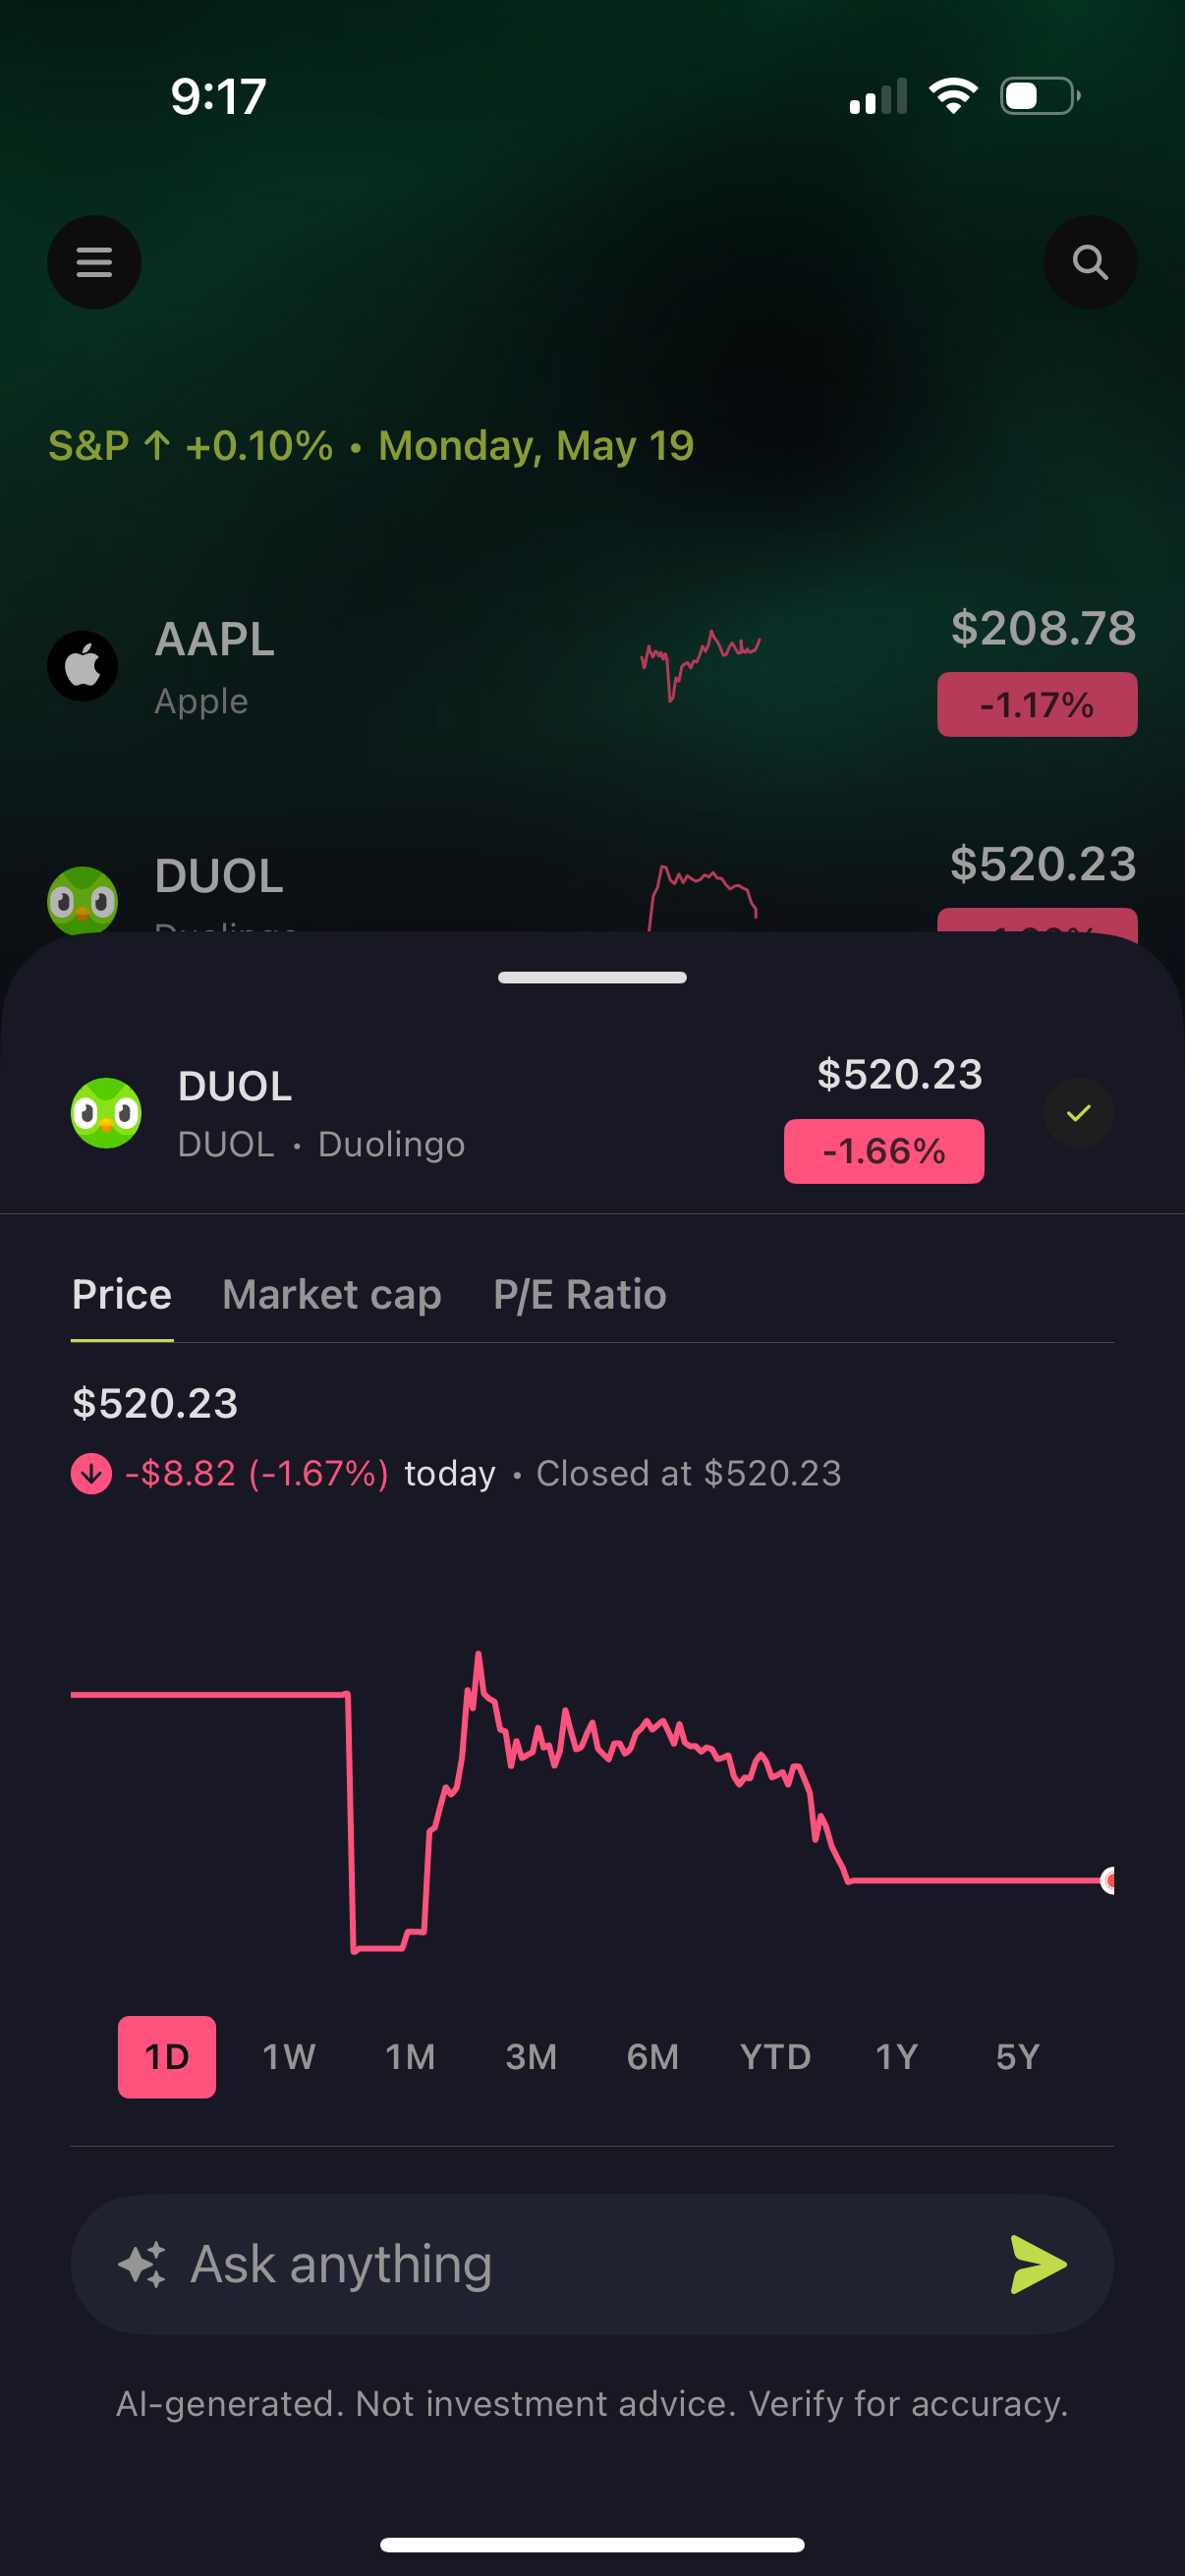
Stock market watchlist screen showing major index performance and a list of tracked stocks with mini price charts and daily percent change, with search and menu access. A bottom-sheet detail view for a selected stock displays current price and daily change, an interactive line chart with timeframe filters (1D–5Y), tabs for metrics like price/market cap/P-E ratio, and an “Ask anything” AI query input.
2
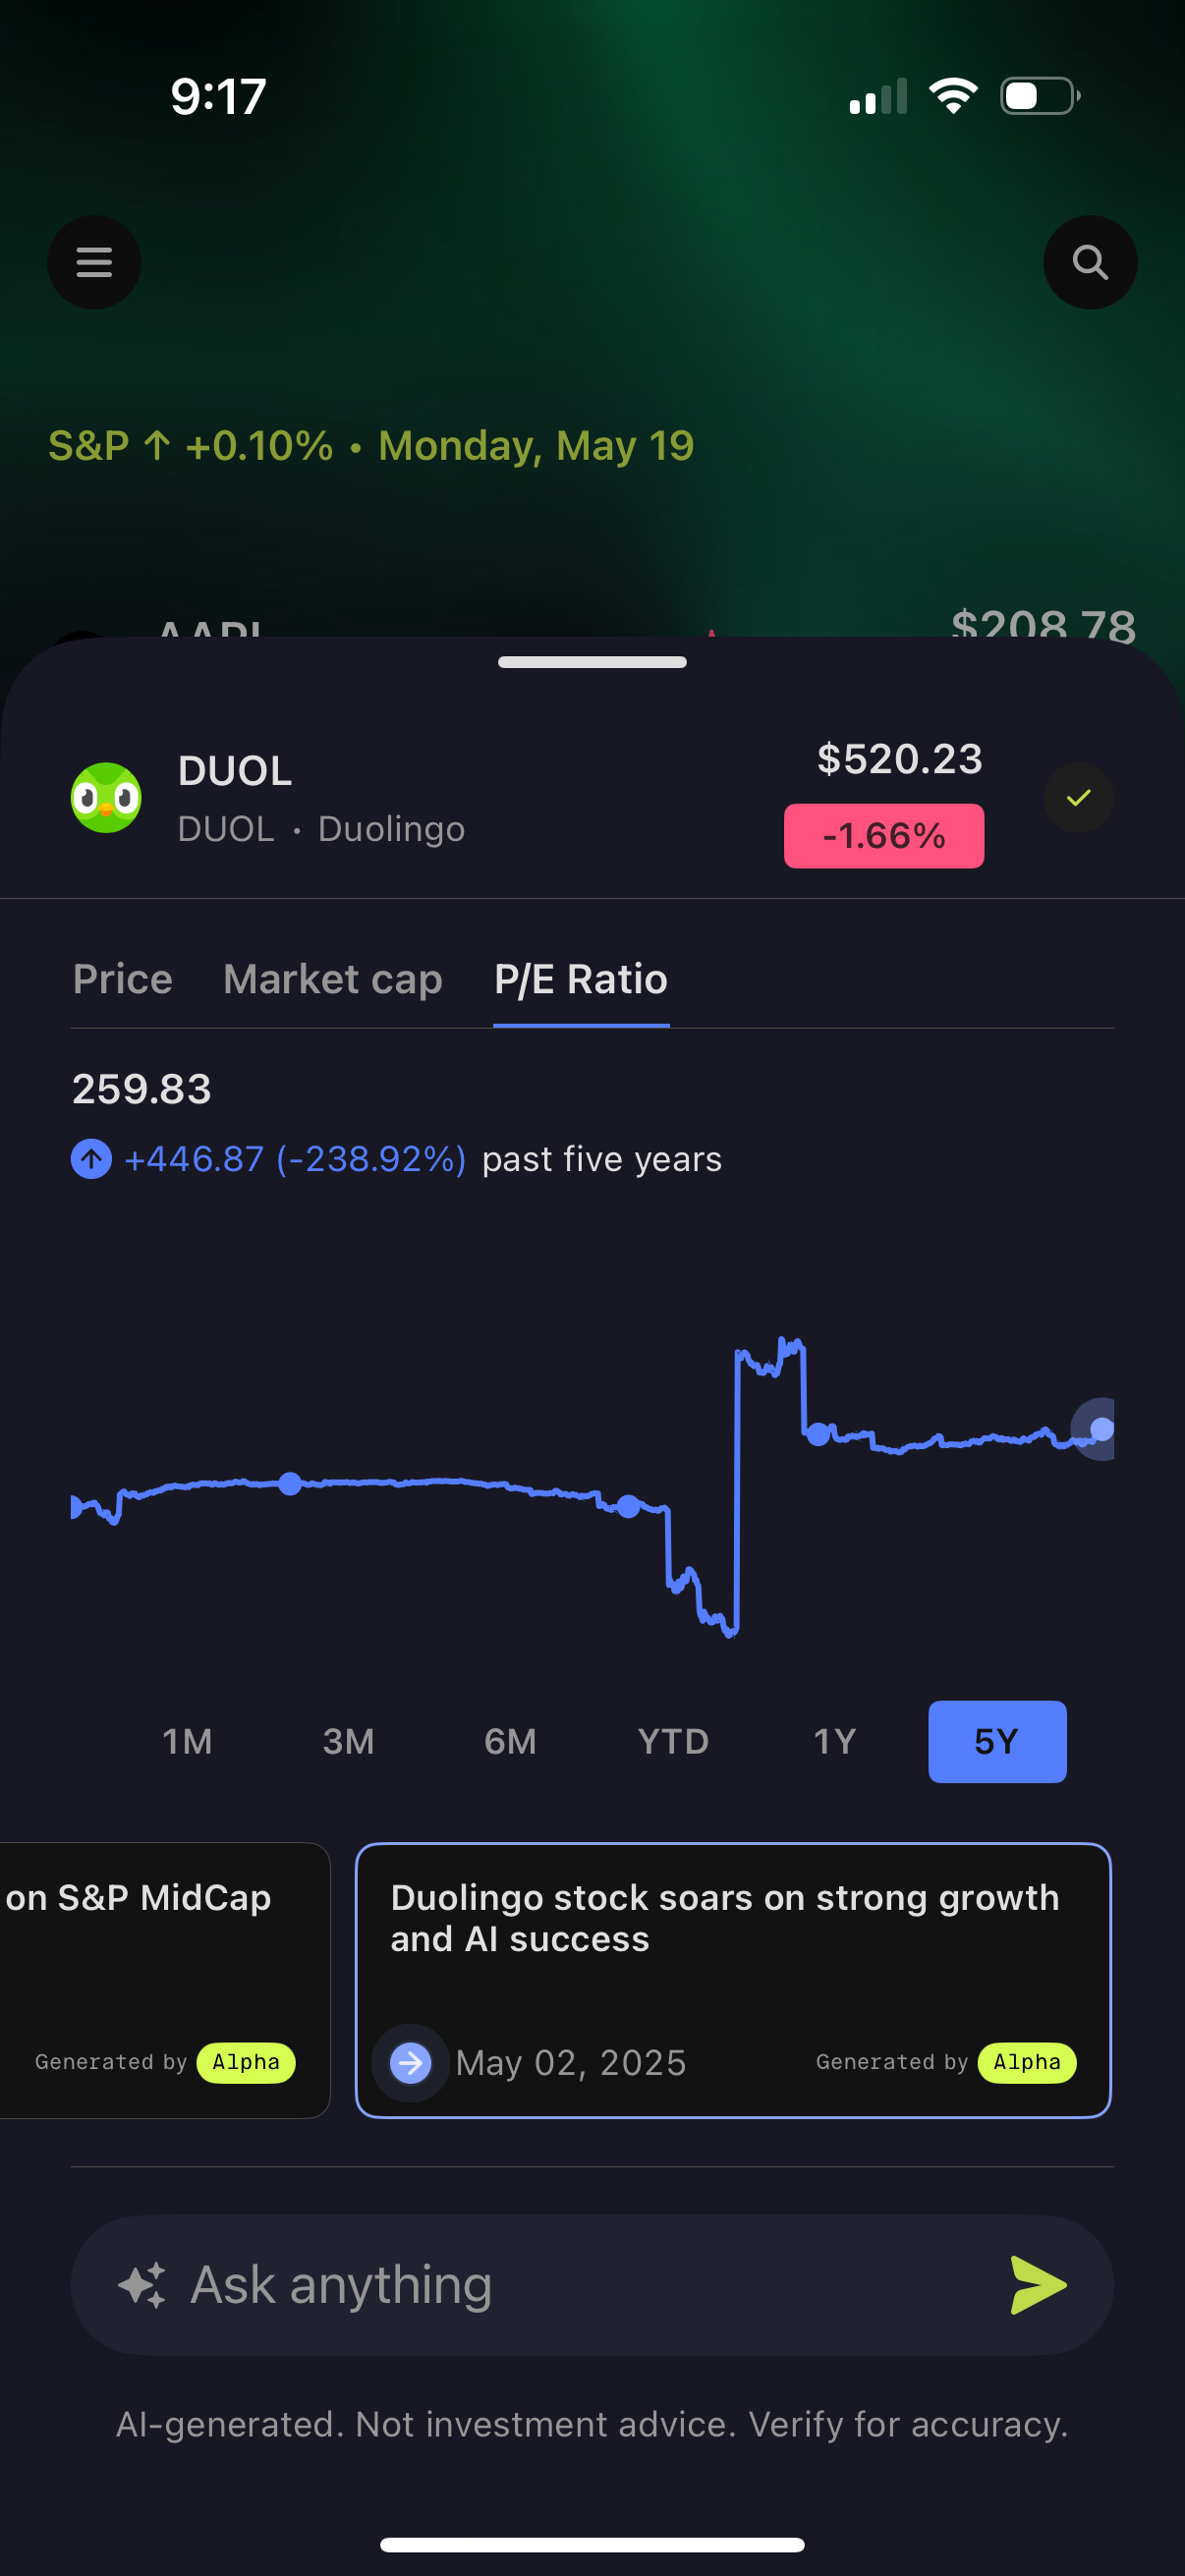
Stock details bottom sheet for a specific ticker showing current price and daily percent change, with tabs to view metrics like price, market cap, and P/E ratio. Includes a 5-year performance line chart with timeframe selectors, related AI-generated news cards, and an “Ask anything” input for querying the stock.